Some more thoughts on random_page_cost
A couple months back I posted
about maybe adjusting random_page_cost to better reflect how current
storage handles random and sequential access. I had a bunch of great
discussions about the topic since then, but ultimately I got
distracted by other stuff.
POSETTE happened last week, with my
pre-recorded talk
about this very topic (and many other great talks, BTW). Which reminded
me that I started thinking about random_page_cost a bit differently.
So here’s an update with some more thoughts.
I did already touch on some of these things in the old post, and then also in the POSETTE talk in more detail.
Before I get to that, let me share a chart with random_page_cost
results from rotational SATA drives. I completely forgot I have these
disks in the machine until I opened the case to do some maintenance.
Those are likely much closer to the storage used for the original
experiments in ~2000. Those would likely be PATA or SCSI drives, but
still rotational. Maybe that will give us values closer to the 4.0 default?
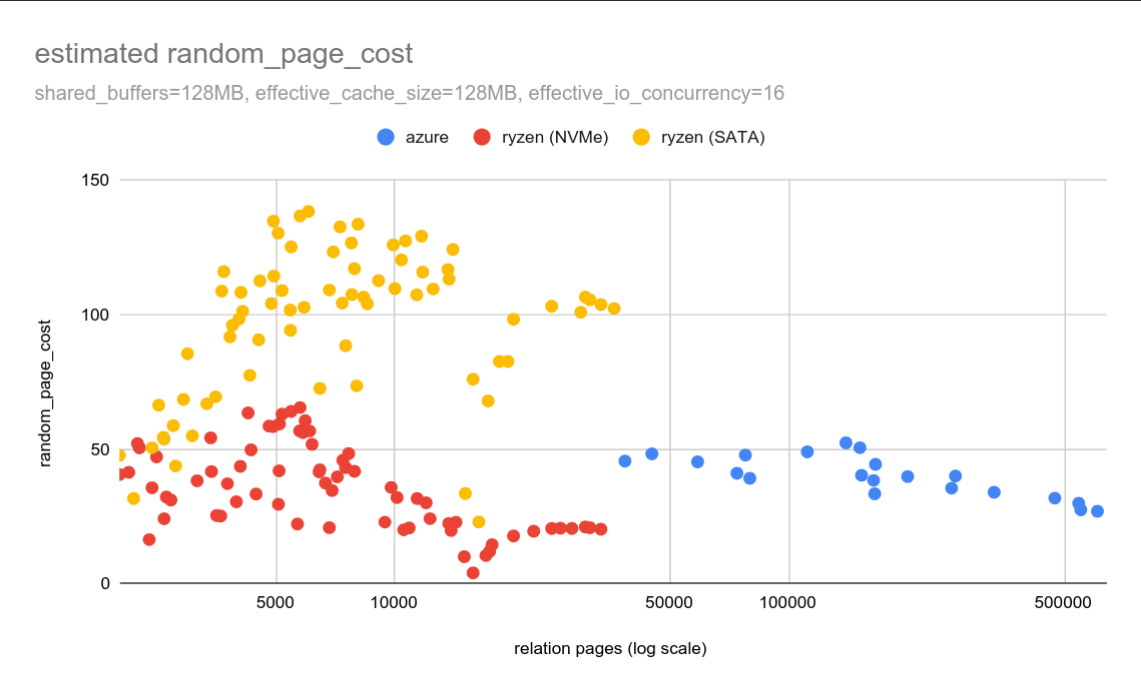
Clearly not. In fact, the estimated random_page_cost is ~125, about
2-4x the estimate for SSD storage. So with SSDs it’s getting closer to
the default, but that’s just a coincidence.
Perhaps there’s some fundamental piece of the old experiment that we failed to recall? Or maybe the “raw” results were adjusted in some way. But it seems the 4.0 default never was the “raw” cost of random I/O.
I got a lot of feedback from people who tried increasing random_page_cost in
the past. In their experience it definitely did not improve the performance, it
hurt it. How is that possible, if it makes the costing less accurate?
I believe it comes to random_page_cost “compensating” for the cost model being
incomplete. It’s not accounting for various caching effects and resources
related to plans performing a lot of random I/O.
Every cost model is an approximation, and a relatively crude one. It’s not possible to have a fast/cheap cost model that accurately mimics every tiny detail. You may make it more and more detailed, but at some point it’d become as large as the original system. And then why have a model? It’d be pretty useless.
Our cost model has a couple gaps that I think matter here.
Cost model (mostly) ignores memory
The cost of an operation is calculated from the amount of CPU and I/O used to execute the operation. Those are two key resources, but it ignores memory
- another important resource.
We have work_mem, but that’s more of a safety limit, as it limits the size of
work buffers (e.g. for sorting or hashing). And it may affect the amount of
I/O an operation needs to do (e.g. smaller buffers in hash join means more
spilling to disk).
But it does not track other memory “used” by a plan, it ignores other uses of memory.
Consider a 100GB table, containing 1GB of “interesting” data (matching our
query predicate). We can scan the table sequentially or through an index. If
the table is “cold”, a sequential scan may push ~100GB of other data from
memory (shared buffers or page cache). The query may run just fine with
work_mem=4MB, but it may effectively “use” 100GB of memory.
On the other hand, an index may only need to access ~1% of the table (the 1GB of interesting data). The random I/O may easily take more time than the sequential scan, but on the other hand it’ll only “use” 1GB of memory. It may evict much less other data from cache.
Yet the cost model is completely oblivious to this.
Locality of access
Another reason is the concept of an active set. You may have a 1TB database, but in most practical systems only a tiny subset of the data is accessed. Users only look at recent orders, etc. This is what we call the “active set” of the database.
The key is to keep the active set in memory. And plans doing a lot of random I/O tend to be more localized, i.e. accessing only the “interesting” data. An index scan will typically access a much smaller fraction of data than a sequential scan. The I/O may be more expensive (random, visiting pages multiple times), but it’s just the “interesting” data.
Sequential scans may massively expand the active set - possibly to the whole database. Which is not great, unless you actually have enough RAM to fit the whole database. Index scans allow for a much smaller active set.
But the planner is completely unaware of the active set. It plans as if all queries start with cold data. It considers caching effects only in very limited cases - e.g. caching within the same query.
The planner is oblivious to various other things. It plans queries in isolation, as if there were no other queries competing for the same resources and the bandwidth was infinite. A sequential scan may be great for a single backend, but when there are 100 backends all doing seqscans, you’ll hit storage bandwidth.
Conclusions
I now see random_page_cost as a proxy for all these effects.
The planner is not costing memory the same way as CPU/disk, nor does it
understand caching effects. Lower random_page_cost values push it toward
plans that are more localized and keep the active set under control. Which in
the long run seems like the winning strategy.
This means there can’t be a tool that’d tell you the “right” value for
random_page_cost after profiling your storage and measuring how it handles
sequential and random I/O. I’d love to have that, but if random_page_cost is
not a raw I/O cost, that would not work.
Tuning random_page_cost has to be system-specific, driven by feedback from
monitoring. For example, you may look at the top queries in pg_stat_statements,
and see if those would benefit from a lower random_page_cost value. Then try to
adjust the value, and monitor if it has the desired impact (or if it hurts other
queries).