So why don't we pick the optimal query plan?
Last week I posted about how we often don’t pick the optimal plan. I got asked about difficulties when trying to reproduce my results, so I’ll address that first (I forgot to mention a couple details). I also got questions about how to best spot this issue, and ways to mitigate this. I’ll discuss that too, although I don’t have any great solutions, but I’ll briefly discuss a couple possible planner/executor improvements that might allow handling this better.
Reproducing the results
I shared the SQL and shell script I used to generate the data sets and queries, but I forgot to mention a couple important details. That unfortunately affected reproducibility.
SQL script (data generator)
The SQL script requires two parameters:
ROWS- number of rows to insert into the tablesCYCLES- number of “cycles” in the cyclic data sets
For my tests I used 10M rows and 100 cycles, which made the tables about 4.3GB each. Something like this should give you about the same database.
$ sed 's/ROWS/10000000/g' create.sql | sed 's/CYCLES/100/g' | psql testdb
The script generates random data, but the size and data distribution / patterns should be the same.
bash script (query generator)
The bash script expects three position parameters:
dbname- the DB to run against (with all data already pre-generated using the SQL script)datadir- Postgres data directory (so that it can be restarted)timeout- timeout for queries (this is just the usual statement timeout in milliseconds)
So run it like this:
$ ./run-test.sh testdb /mnt/pg/data-directory 60000
You might need to adjust the timeout a bit, depending on the type of storage you use. The goal is to allow most queries complete, and only abort some extreme cases.
Postgres configuration
The last piece is the configuration of the instance. I’ve done only the most basic tuning of parameters, especially:
shared_buffers = 32GBrandom_page_cost = 2
The shared_buffers value affects the execution a little bit, but it’s
not considered during planning. The random_page_cost parameter is very
important, and it affects planning in an interesting way. I’ll discuss
it in detail in a bit.
All other parameters were left at default values.
With this you should be able to reproduce the same behavior I described in my post. You’ll also need a trivial drop-caches.sh script, which simply evicts everything from the page cache to get “cold” query durations.
Of course, the exact behavior depends on the hardware, but if you’re running on some sort of flash storage (ideally local SSDs), you should see the same behavior I presented.
random_page_cost
It took me a while to figure out why several people struggled to
reproduce the poor plan choices I saw. Then I realized they’re running
with the default parameters, especially random_page_cost = 4. Once
they changed it to the lower value 2, they got the same “Index Scan”
plans. Why is that?
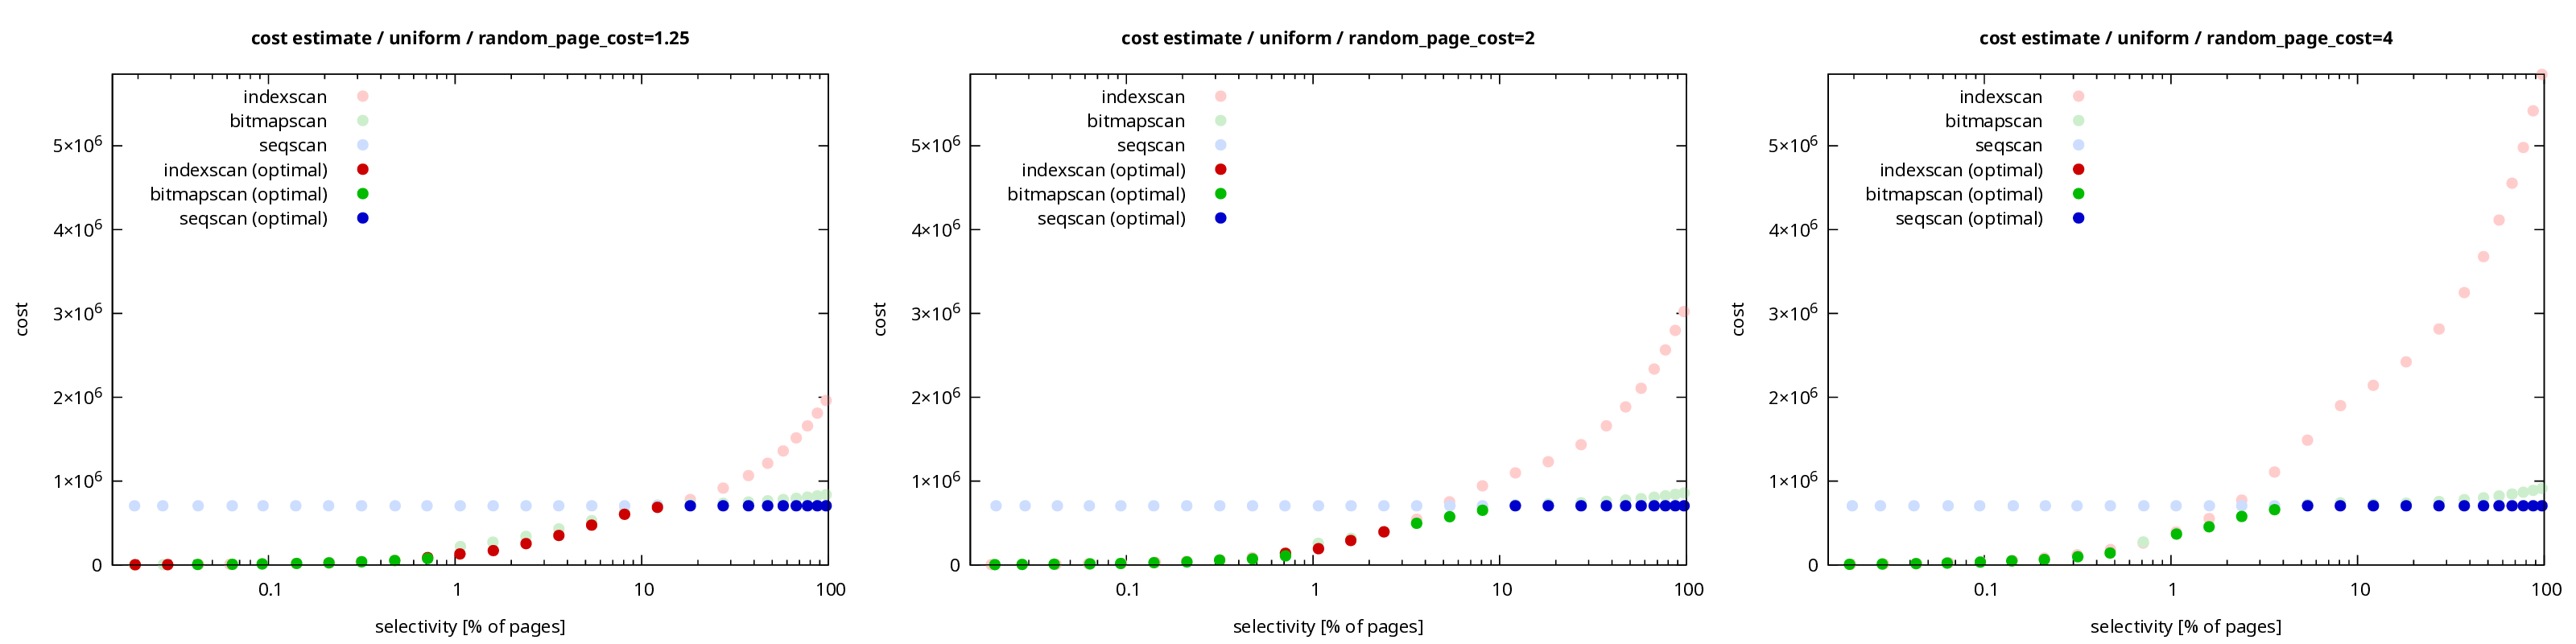
Consider the following chart, with estimated costs of the three basic
types of scans with random_page_cost values 1.25, 2 and 4. This is for
the uniform data set, about the simplest type of data distribution. Use
PNG or PDF for higher-resolution
versions of the chart.

The random_page_cost value has no impact on the sequential scan (blue
dots), and bitmap scans seem almost unaffected too (the cost does
change, but not much).
The cost of index scans changes a lot. That makes perfect sense, because
index scans do a lot of random I/O, it’s the dominant part of the cost.
The lower the random_page_cost, the cheaper the index scan. It’s
clearly visible on selectivities between 10% and 100%.
The total cost is roughly proportional to the random_page_cost value.
Going from 4 to 2 cuts the cost to 50%, and going to 1.25 means about
30%. At least for selectivities 10-100%, it’s less visible close to 0%.
But the planner does not care about the cost of individual plans in
isolation, it cares about how it compares to other plans. And these
charts show that as the random_page_cost value decreases, index scans
start to win (over bitmap scans) more often. The dark points show which
scan is picked by the optimizer. The number of red ones increases, which
means the planner picked index scan as the cheapest one.
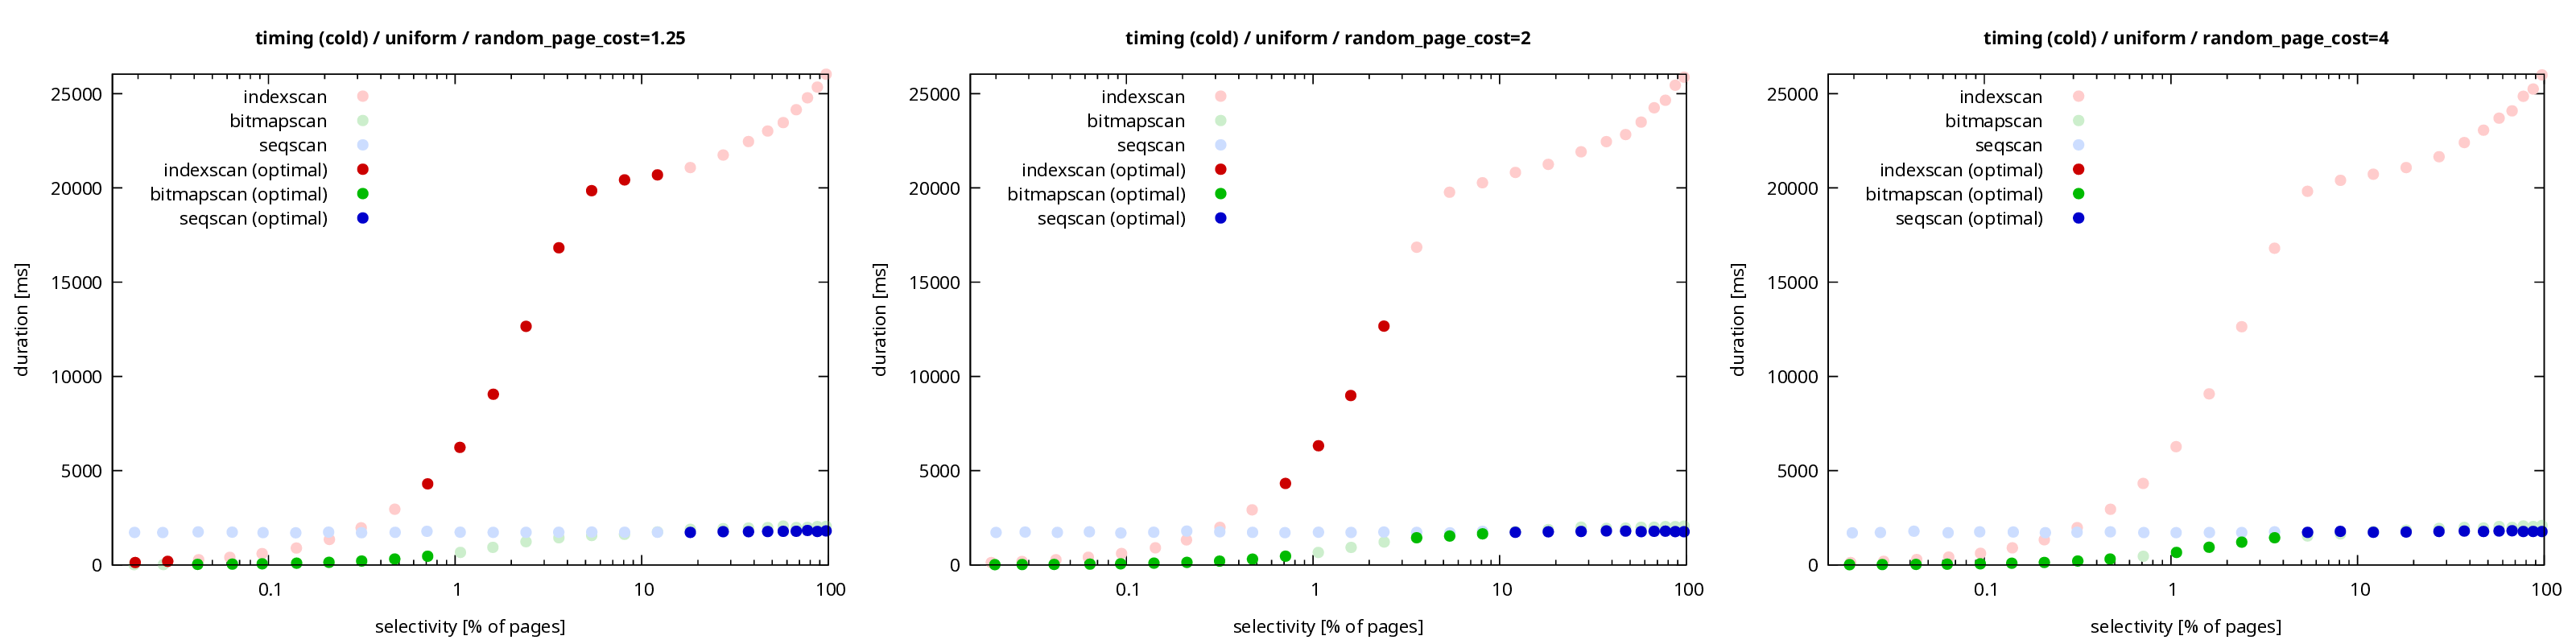
cold data
Here are charts of duration for “cold runs” (with no data cached)
for the same random_page_cost values (PNG or
PDF).

The shapes do not change at all for different random_page_cost values,
which makes sense - the parameter only matters for planning. Once a plan
is picked, the value becomes irrelevant. The duration of a plan does not
depend on how it was selected.
But the shift in picking index scans as the “optimal” plan more often
still applies. The lower the random_page_cost, the higher the
selectivity where the planner thinks it’s the cheapest plan. For
random_page_cost = 4.0, the index scan wins only once at ~1%. For
random_page_cost = 1.25 it wins everywhere between 1% to 10%. And in
all those cases it’s much slower than the bitmap scan (and even
compared to seqscan).
warm data
The above chart is for durations on cold data, i.e. with both shared buffers and page cache empty. If the data is cached, you get this chart instead (hi-res PNG or PDF).
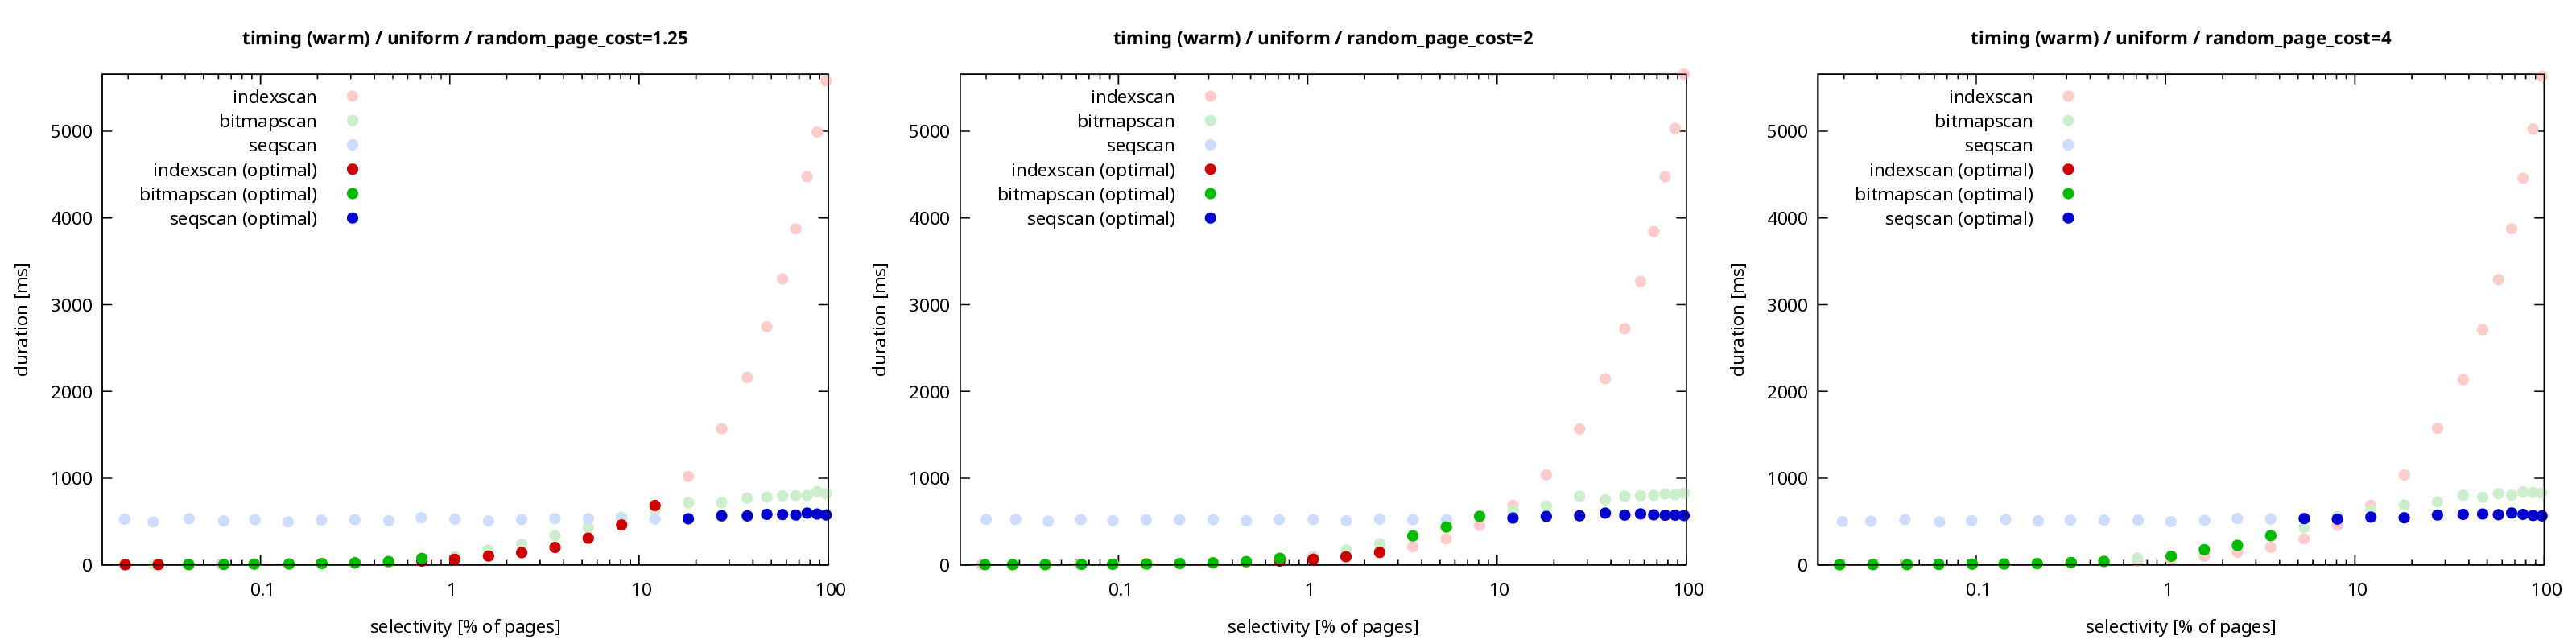
")
We see the same shift between plans, but without the I/O the differences are mostly negligible. It’s nice and smooth and does not get much slower than the “dumb” sequential scan.
Is “random_page_cost = 2.0” wrong?
So did I make a tuning mistake when I changed the random_page_cost?
I don’t really think so. The default value (4) is decades old at this
point, and it was set back when everyone used “old” rotational disks.
While there’s still a difference between random and sequential I/O even
on modern storage (like NVMe flash), it’s getting smaller. Based on
this, it makes sense to reduce the value.
I’m aware of recommendations to set random_page_cost much closer to
1.0, and even the official documentation
mentions potentially setting it to 1.1 for SSDs:
Storage that has a low random read cost relative to sequential, e.g., solid-state drives, might also be better modeled with a lower value for random_page_cost, e.g., 1.1.
That might be too aggressive. Even with NVMe SSDs, random I/O remains
more expensive than sequential I/O. So unless you assume everything is
cached (like in the “warm” case above), I’d stick to higher values.
Maybe if you do some careful testing on your data set and workload, but
without that 2.0 seems like a reasonable compromise.
The estimated cost might also be off due to some other estimates being
significantly off. For index scans the cost is calculated by
cost_index(),
so maybe it mis-estimates some input parameter? Say, number of heap
pages to visit? I did check that for the presented examples, and I don’t
think that’s happening. Which is not surprising, uniform distribution is
the default assumption of all the formulas, fairly easy to estimate.
It’s the case where the estimates tend to be most accurate.
How to identify the issue?
So how do you identify you’re affected by this behavior? I’m not sure.
If you’re executing queries on the “threshold” between the fast and slow plans, you might notice there are two modes. This is the case discussed in my “performance cliffs” talks. That’s easy to notice.
But if your queries consistently fall into the “slow” region, you’ll
only see the slow executions. How would you know a faster plan is
possible? You’d have to guess there’s a faster plan, and then experiment
with enable_ options until you convince the planner to pick it.
Such experiments are doable only for a small number of relatively simple queries. As queries get more complex and/or the number of queries increases, it gets hard to explore them. You may focus on the expensive queries, but you still won’t know if a better plan exists.
How could we fix / improve this?
I hesitate to call this behavior a bug, because it works as designed. I can’t rule out the possibility of a bug, of course. Feel free to investigate, I might have missed something.
Is there something we could do about this in the database itself? I have a couple ideas …
Should we adjust random_page_cost default?
In the presented examples the fundamental problem seems to be the costing
of index scans. Maybe it’s all due to random_page_cost simply being
too low? Maybe it’s time to re-evaluate what the default should be?
Or maybe we should have some automated way to tune the parameter for
specific hardware?
Every now and then there’s a suggestion to have a tool similar to
pg_test_fsync that’d do some I/O tests and compute the “correct”
random_page_cost value. Maybe we should try implementing such a tool,
but there’s a catch. It probably can’t be just a “simple” hardware test,
as the value is not a simple ratio of costs for random vs. sequential
I/O.
AFAIK the current default (4.0) was picked based on a benchmark that
ran queries with different scan types, and 4.0 happened to switch plans
at the “right places.” I’m sure it’s described in some old thread on
pgsql-hackers,
but I can’t find it at the moment.
So it’s a value selected so that the cost model makes the right decision, which is a little bit backwards.
If implementing this in a tool turns out to be too difficult, perhaps
we should at least redo the benchmark and adjust the random_page_cost
default (or the tuning advice) accordingly?
The expectation is we’d end up with a lower random_page_cost value,
because the hardware got much better in handling random I/O. But I’m not
entirely sure of that. We’ve improved all parts of Postgres, and some of
that likely made sequential scans cheaper. The OS also improved relevant
bits (like readahead etc.). I wouldn’t be surprised if we actually ended
up with a higher random_page_cost default.
Make the cost model aware of prefetching?
Another thing that occurred to me is this may be due to the optimizer not considering prefetching. Bitmap scans prefetch heap pages, while index scans do not. Yet the optimizer is oblivious to this.
This may not have been that obvious with effective_io_concurrency = 1,
but PG 18 increases the default to 16, and that likely helps bitmap
scans quite a bit. Maybe it’s time to account for this when costing
bitmap scans?
We could also do the opposite thing, add prefetching to index scans. We need to do that for other reasons (e.g. to support direct I/O), and I’ve been working on this for quite a while. Here’s a chart from one of the tests including index scan with prefetch:

Prefetching would put index scans on par with bitmap scans, at least for the “medium selectivity” up to ~10%. Above this threshold the bitmap scans benefit from only visiting each page once (and in a sequential pattern), while index scans have to visit it repeatedly.
But even with this, when scanning 100% of the table, prefetching makes the index scans 2x faster.
Summary
Ultimately, there’s only so much we can do in the optimizer. It makes decisions based on a very simplified approximation of the data set, and so it’s bound to make mistakes. And we’re not making its task any simpler by adding more and more options to the executor. Every option to run a query differently means an opportunity to make a mistake.
I don’t think it’s possible to fix that by making the planner smarter. We should keep improving the planner, of course. And there are interesting ideas like better stats, adaptive optimization, or using feedback from past executions. We should explore that.
But such a priori decisions simply can’t be 100% correct. An “perfect” planner that never makes mistakes (with arbitrary queries on arbitrary data) is an unachievable goal.
We need to improve the executor to be more resilient against such mistakes, and handle them gracefully. There’s a whole research discipline focused on robustness of the query execution.
Note: As a starting point I highly recommend the series of Dagstuhl Seminars on robust query processing in various contexts (the link is for 2024, scroll down to “related seminars”).