Performance archaeology: OLTP
The Postgres open source project is nearly 30 years old, I personally started using it about 20 years ago. And I’ve been contributing code for at least 10 years. But even with all that experience I find it really difficult to make judgments about how the performance changed over the years. Did it improve? And by how much? I decided to do some benchmarks to answer this question.
The main reason why answering such questions is hard is we don’t have good data for comparing this many Postgres release. So I decided to get the data myself. I ran a lot of benchmarks releases since Postgres 8.0, with configuration that I think was “reasonably fair” for all versions. And I presented the results at pgconf.eu 2024, with some nice charts showing how the performance changed. There’s a recording of the talk, and the slides, if you’re interested.
Note: There are many other interesting talks from the same event, and also from the previous year. I very much recommend visiting the PGEU channel. There’s also the channel for the PostgreSQL Developer Conference.
In this blog post I’m going to present results from a slightly improved benchmark. The conclusions are generally the same, but with additional details that didn’t make it to the talk. Either I didn’t have time to cover that in the 45 minutes, or it’s something I only learned after the talk (often due to feedback from attendees).
I’m going to split this into two posts - in this first one I’ll look at OLTP workload, and then in a separate post I’ll deal with OLAP. That’s how the talk was organized too.
I recognize these benchmarks are somewhat simplistic and maybe extreme. The OLTP consists of just trivial point queries (by primary key), and the OLAP is just a couple big analytical queries. Most workloads are a mix of these cases - but that’s something you need to consider, I don’t know your application.
Note: I’m also sure there are workloads that don’t really fit onto this OLTP-OLAP scale very neatly. Full-text or vector search are good examples with somewhat specific requirements, I think.
Why is the answer hard?
I claimed it’s quite difficult to quantify the performance evolution. But why is that? There’s a lot of benchmarking done, surely we could just look at the results over time, right? Sadly, no.
Development benchmarks
We certainly do a lot of benchmarks as part of the development, while working on patches. But those benchmarks are usually very focused, both at the feature and area of code - it’s often more a microbenchmark than a generic benchmark.
Those tests are meant to compare two small commits, not major releases. The may be dozens of such partial improvements in each release, and the effects don’t combine easily. Two patches may bring 10% speedup each, but may not yield 20% speedup when combined.
Furthermore, these tests may happen on very different hardware, depending on availability. And results on different CPUs may be wildly different - a patch may help only one particular architecture, for example. For some patches that’s even the intent.
Application metrics
Aren’t users in a better position to quantify the changes? There usually is some application monitoring in place, tracking number of requests, latency, and so on. So it should be possible to calculate some interesting metrics for each Postgres version.
Few applications go through every major release. Systems often run one version until it gets close to EOL, and then it’s migrated to the latest supported version. So a system might have started at PG10, and then got upgraded to PG14, skipping a bunch of major versions. That limits which versions we have data for.
Also, systems generally are not static. Applications evolve over time, existing features get improved, new features get added, stuff like that. That means the workload changes over time. But the environment changes too! You’re unlikely to run the same hardware for 20 years, and we’ve seen some fundamental shifts.
In 2004 most CPUs had a single physical core, less than 64GB of RAM (and that was the max most servers could handle), and used spinning drives to store data. Today, a machine can easily have hundreds of cores, hundreds of GBs of RAM, fast NVMe drives, etc.
And it’s not just about the hardware. The other parts of the system also got a lot of improvements too. The kernel and filesystems got much faster, and Postgres just benefits from that. So even if you kept the same hardware, this would affect the results.
So while the application metrics may be interesting, they are not very useful for comparing performance of multiple Postgres releases.
Can it even be a fair comparison?
While working on this benchmark, I repeatedly asked myself how fair can such a comparison even be. It’s a simple truth that we always optimize for current hardware, available at that moment. Not only is it hard to predict future hardware trends, it also doesn’t provide much value to users.
The point is that it’s not the fault of old Postgres releases if they do not perform well on many-core systems, for example. At that point there were no such systems, so why optimize for that. Yes, it took time to address that, but it’s a matter of the usual engineering trade offs.
Of course, the number of cores is not the only hardware metric affected by this. The same thing applies to storage vs. CPU balance, growing amounts of RAM, etc.
Keep this in mind when evaluating the results presented later. To make the comparison understandable and focused on Postgres, I had to pick a fixed hardware configuration. It can’t be “correct” for every point in time, but I tried to pick a “reasonable” compromise.
An alternative would be to pick multiple configurations with comparable costs, each for a different period of time. And then measure not just the “raw” performance (e.g. throughput), but rather “per $” values. But (a) getting such hardware is difficult, and (b) it’d make it harder to isolate the hardware-related improvements.
Hardware
So instead, I decided to pick a hardware configuration from ~2016. That is about half-way through the covered time period (Postgres 8.0 was released 20 years ago).
For the OLTP tests I ended up using the same machine I use for most of my benchmarking. It’s a 2-socked E5v4 Xeon (Broadwell) machine, with this configuration:
- 2x Xeon E52699v4 (44 cores / 88 threads)
- 64GB RAM (DDR4)
- WD Ultrastar DC SN640 960GB (NVMe SSD, PCIe 3.1)
- Debian 12.7 (kernel 6.10)
- ext4
- gcc 12.2.0
I don’t think comparable systems were available in 2004, when 8.0 was released. Not with that many cores, certainly not with NVMe storage. It’s still a fairly capable machine nowadays.
20 years of Postgres releases
When I started working on this, my ambition was to compare at least the last 10 releases, but I was willing to try how far back I can go. We rely on a couple external tools, and those tools evolve too, which can complicate building old releases.
The main challenge turned out to be bison, which is a parser generator
we use to process the gram.y
grammar. But bison is developed too, and every now and then the
rules need to be tweaked to work with the new bison version. Going
back, I had to build a custom bison 3.0 for releases before Postgres
9.1 to make it build. Same for flex 2.5.39, which is used with bison.
I also had to disable ecpg - maybe I could have fixed that, but as I
didn’t need ecpg I just disabled it instead. I also had to fix a
duplicate definition of optreset (comment out one of them), and
with that the builds started to work all the way to Postgres 7.4.
Note: It seems parallel builds with make -jN have weird issues
on old releases, so better build without parallelism.
When I say “started to work” I only mean that make completes. It does
produce a lot of compiler warnings (which we always fix on supported
releases), but the build completes, and make install is possible.
Sadly, on 7.4 and 8.1 the produced builds seems to have issues, and
initdb fails with errors like
...
creating directory /mnt/data/pgdata/pg_tblspc ... ok
selecting default max_connections ... 100
selecting default shared_buffers ... 1000
creating configuration files ... ok
creating template1 database in /mnt/data/pgdata/base/1 ... ok
initializing pg_authid ... FATAL:  wrong number of index expressions
child process exited with exit code 1
initdb: removing data directory "/mnt/data/pgdata"
...
My guess is that this is a bug that got exposed due to some improvements
in gcc, and that got fixed only on newer Postgres releases. It’s just
a guess, though - I haven’t investigated this.
I could have built with older GCC, and while that would likely work, but then it would be hard to say if the difference is due to changes in Postgres or in GCC. Instead I decided to skip 7.4 and 8.1, which means that in the end I have these builds: 8.0, 8.2, 8.3, 8.4, 9.0, 9.1, 9.2, 9.3, 9.4, 9.5, 9.6, 10, 11, 12, 13, 14, 15, 16, 17, 18dev. That’s 20 releases, starting with 8.0, first released in 2004.
pgbench
I suppose I don’t need to introduce pgbench, the traditional tool for benchmarking Postgres databases. It’s a very simple tool to use, and has a simple TPC-B-like workload built-in. But it can also be used with SQL scripts to generate arbitrary workloads.
For this comparison I went with the two built-in workloads, i.e. the read-only and read-write. For each workload, I want to test a range of combinations, because that will allow us to see which cases improve or regress, which I think is interesting.
I ended up using these parameters:
- scale: 100, 1000 and 10000 (that’s 1.5GB, 15GB and 150GB)
- clients: 1, 8, 16, 32, 64, 128, 256
- mode: simple, prepared
- type: read-only, read-write
The scales are chosen so that the data fits into shared buffer, RAM or exceeds RAM (by a factor of at least 2). The client counts cover both low- and high-concurrency cases (256 is about 6x the number of physical cores).
Note: If interested, you may inspect the bash script used to drive the test. It has some paths hard-coded, but it should be fairly easy to understand and adopted for your tests.
If you multiply this together (including the 20 releases), that’s 1680 combinations to test - not a small number. I decided to do 3 runs for each combination, each run being 5 minutes.
That’s 25200 minutes, i.e. about 18 days, just for the runs. Additional time is needed to initialize the databases, etc. So maybe 21 days for the whole benchmark. Of course, it took multiple attempts to get all the details sorted out, so this is a multi-month effort.
Ideally the runs would be longer (especially for the read-write runs), to stabilize the behavior. But that would increase the amount of time needed for the testing too much. I had to pick a compromise and I think this is sufficient to get meaningful results.
Note: All tests were run using pgbench from the current
development version (i.e. 18dev). pgbench is also being improved, to
handle more connections/clients, and so on. We don’t want to be hitting
bottlenecks in older pgbench version - it’s not our goal to benchmark
pgbench.
postgresql.conf
Another important detail is Postgres configuration. The defaults are rather conservative and far from optimal on modern hardware. And the defaults do change over time, which might make harder to compare releases.
As my goal was to get a fair comparison of performance over time, I decided to use a configuration that is about the same for all releases. It’s not perfect, because some of the options were fundamentally reworked, and some didn’t even exist on the oldest releases.
I ended up with this:
shared_buffers = 262143(the largest value supported by 8.0)checkpoint_timeout = 1800(30 minutes is reasonable)max_connections = 1000(more than we actually need)work_mem = '32768'(not that important for OLTP)more aggressive autovacuum (not available on 8.0)
autovacuum_vacuum_scale_factor = 0.01autovacuum_analyze_scale_factor = 0.05autovacuum_vacuum_cost_limit = 1000autovacuum_vacuum_cost_delay = 2ms
checkpoint configuration
checkpoint_segments = 8192(up to 9.4)max_wal_size = '128GB'(since 9.5)min_wal_size = '32GB'(since 9.5)
I think this config is reasonable and sufficient for the comparison. An alternative would be to tune each individual release, but that would require a lot of time.
Anyway, enough talking. Let’s look at some results ;-)
Results
The following couple sections present throughput charts by dataset size
(small, medium and large). For each size we have read-only (-S) and
read-write (-N) runs, with either simple (-M simple) or prepared
(-M prepared) query protocol.
The overall behavior is very similar for all the cases, and in the talk I presented only some of this because of limited time. But in this post I’m publishing everything, for the sake of completeness. I’ll comment on some of the charts, but it’s rarely the case that a comment applies to just that one chart - I just don’t want to repeat the observations over and over.
If you want to look at the raw results, check this CSV. There are yet more detailed results (with per-second data) in the full .tgz.
small / read-only
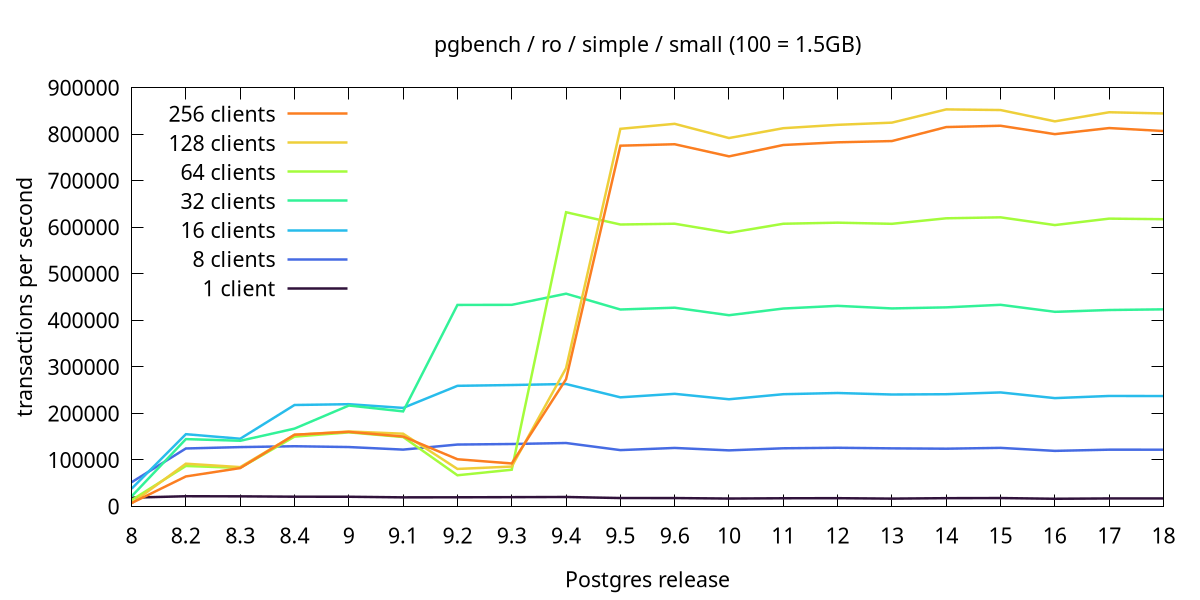
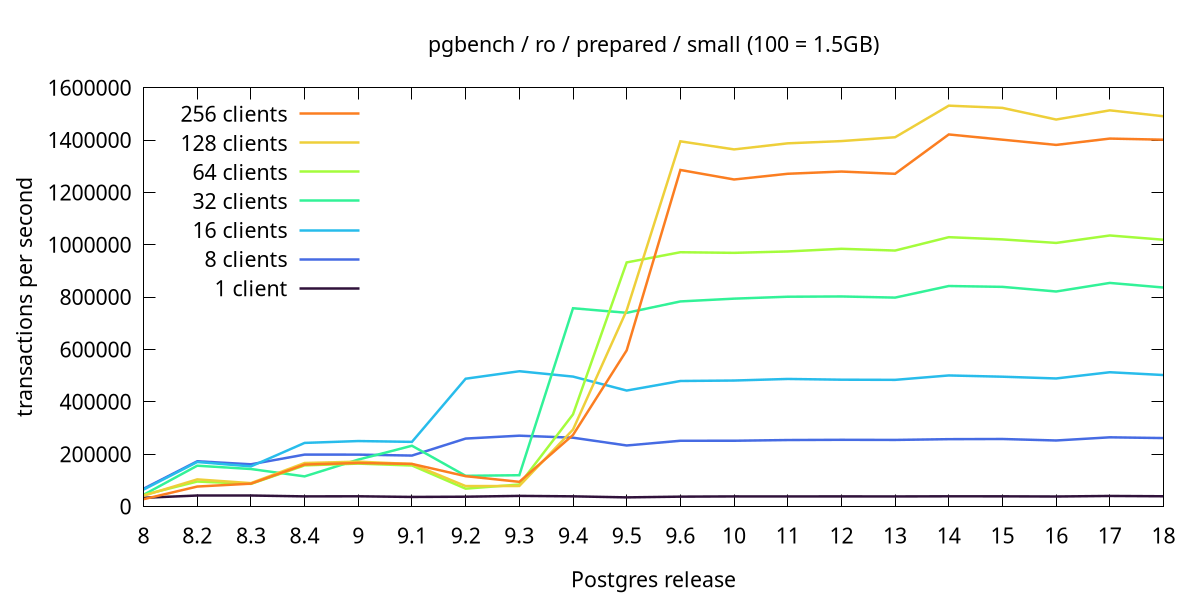
Read-only pgbench on a small data set (1.5GB which nicely fits into shared buffers) is about the fastest workload possible with simple queries. After warming up, the database doesn’t need to load any data from the OS, etc. The throughput evolved like this:
Since Postgres 9.5, the behavior is quite nice and reasonable - we get
better throughput with more clients, except for 256 clients where the
throughput drops a little bit. There’s not much difference between
simple and prepared query modes, except that with -M prepared you get
about 50% better throughput.
Before Postgres 9.5 it’s not that nice, though. For one, the throughput is much lower - 1/10 or less, compared to later releases. But more importantly, it doesn’t handle higher client counts well. We expect the throughput to improve as the number of clients grows until the CPU gets saturated, and then to stay about the same.
The machine has 44 physical cores, 88 with hyper threading, so we expect improvements well above 64 clients. But these older releases peak at 16 clients, and then quickly regress to a much lower throughput. That is not a very healthy behavior.
This is a nice example of the trade offs. This behavior is not due to poor development practice - the simple fact is that until ~2014 (i.e. Haswell) most x86 systems had maybe 8-16 cores. And for those client counts, it performs reasonably well. With 8 clients we get ~200k transactions, while later releases do ~250k. The regressions with more clients are not great, and later releases do better in this regard, but it’s not that terrible.
And then as such systems became more common, Postgres 9.5 and 9.6 (both released in 2016) brought quite a lot of optimizations. Hence the huge improvements in those releases.
I’ll point out one additional weirdness in these charts. If you look at 32 clients on Postgres 9.2 and 9.3, you might notice that simple query performs much better than prepared query mode. That’s quite against expectations of what the prepared query mode does! Luckily the later releases fix this.
small / read-write
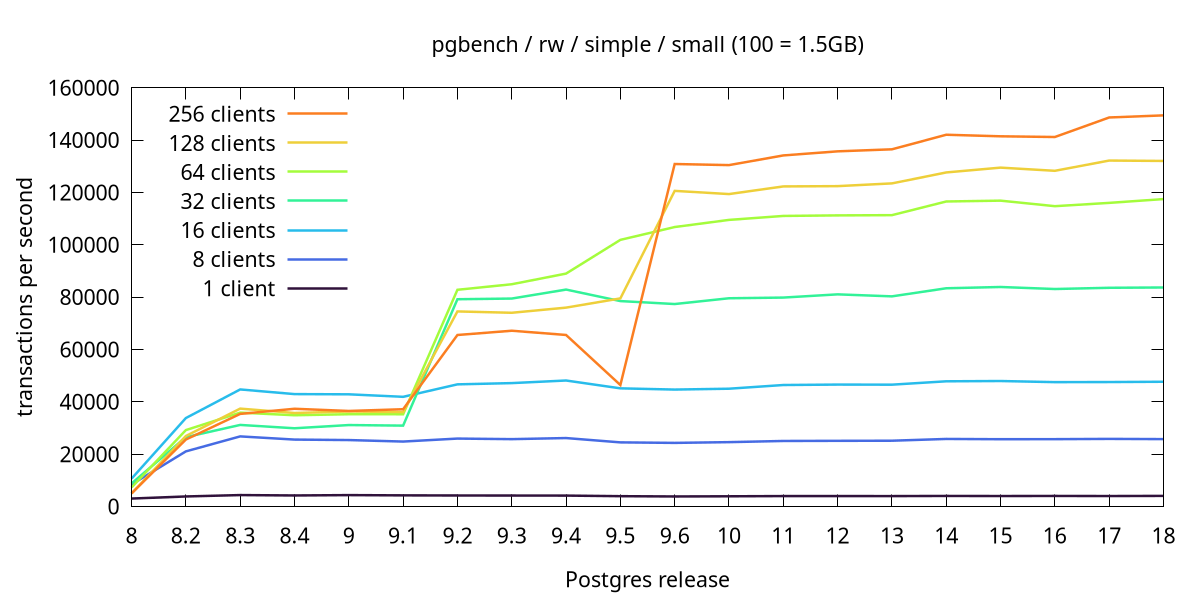
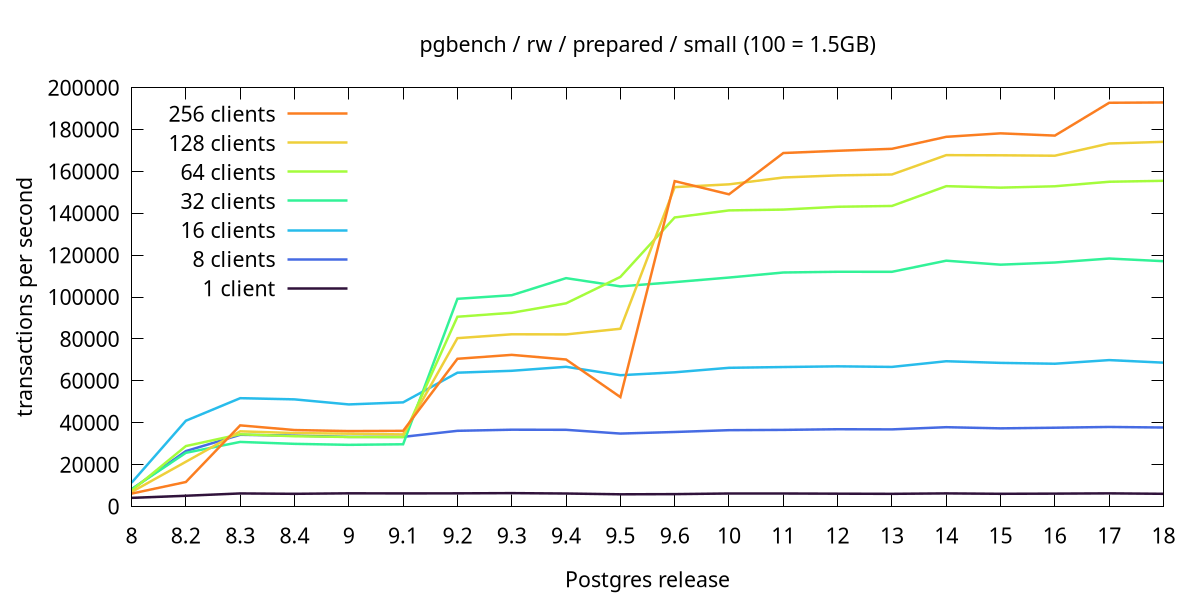
For read-write workload, we get a similar overall behavior, with big improvements in 9.2 and 9.6.
The throughput is much lower compared to the read-only tests (but that’s entirely expected, of course). The good news is there are no major regressions with higher client counts. It looks generally sensible.
medium / read-only
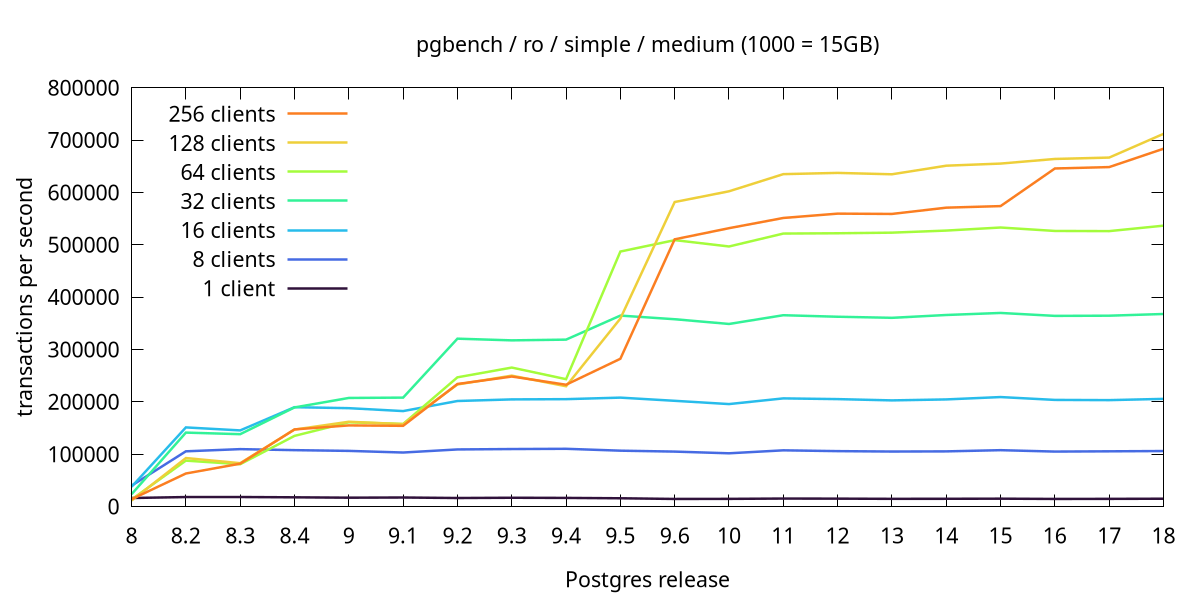
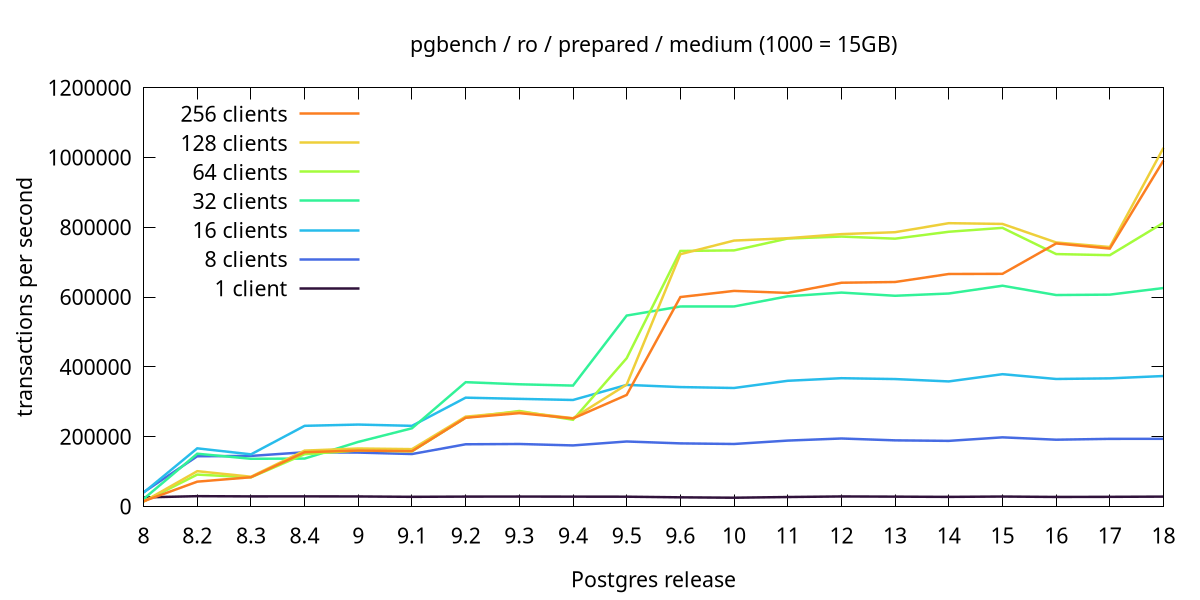
For medium scale (larger than shared buffers, but fits into RAM), we still see improvements on older releases, with the biggest jump in Postgres 9.6.
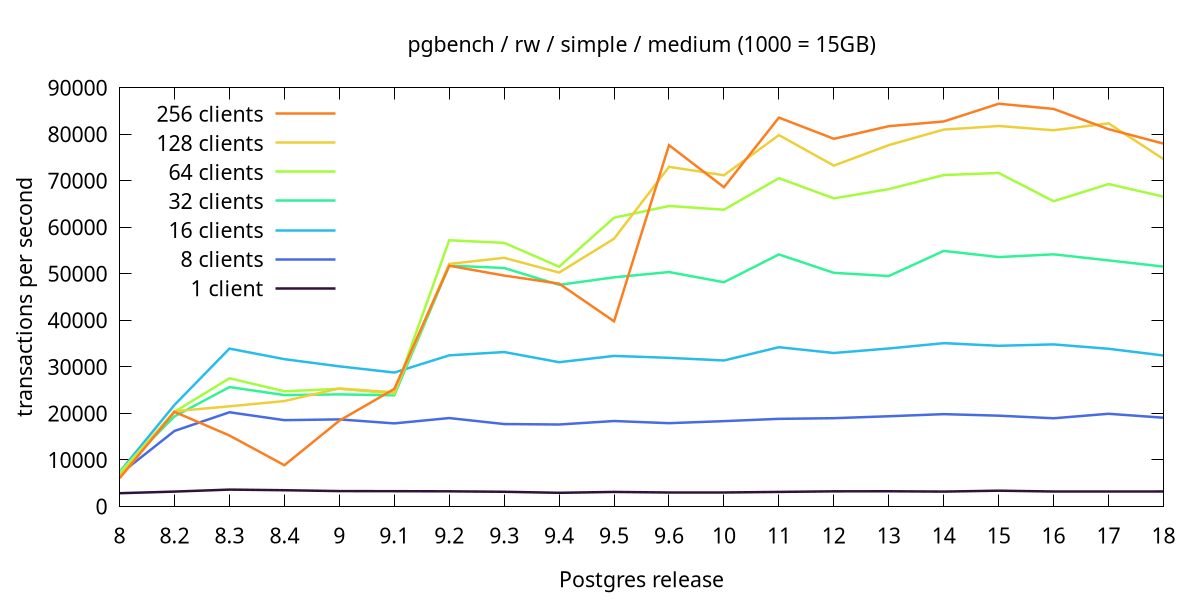
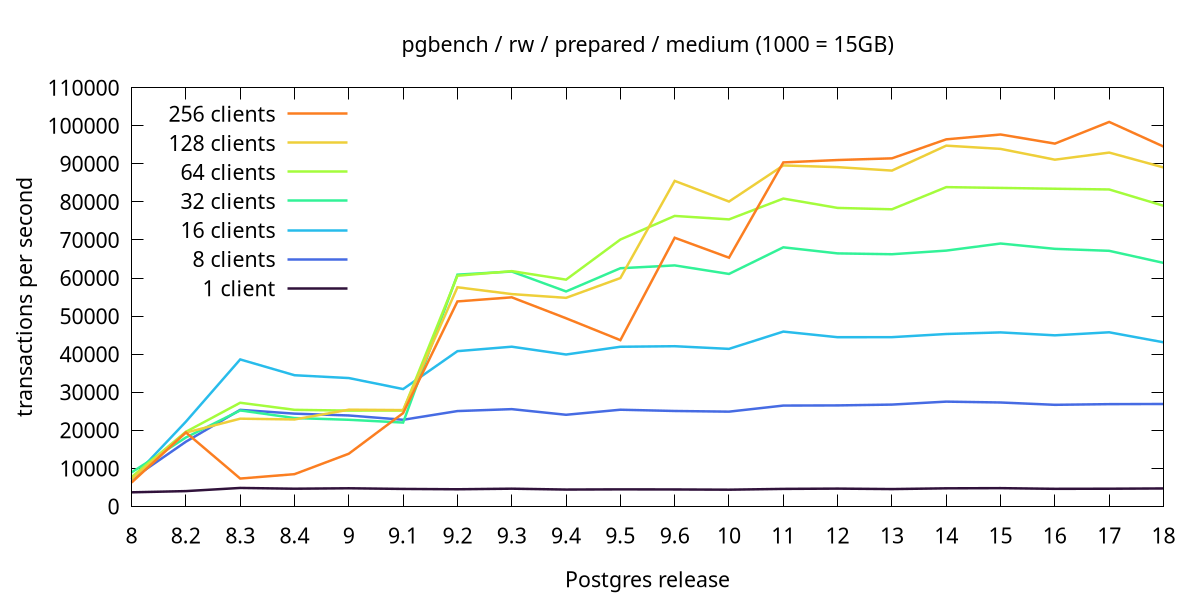
Compared to the small scale, higher client counts are handled much better - there are no weird “inversions”. This applies both to read-only and read-write charts in the next section.
medium / read-write
large / read-only
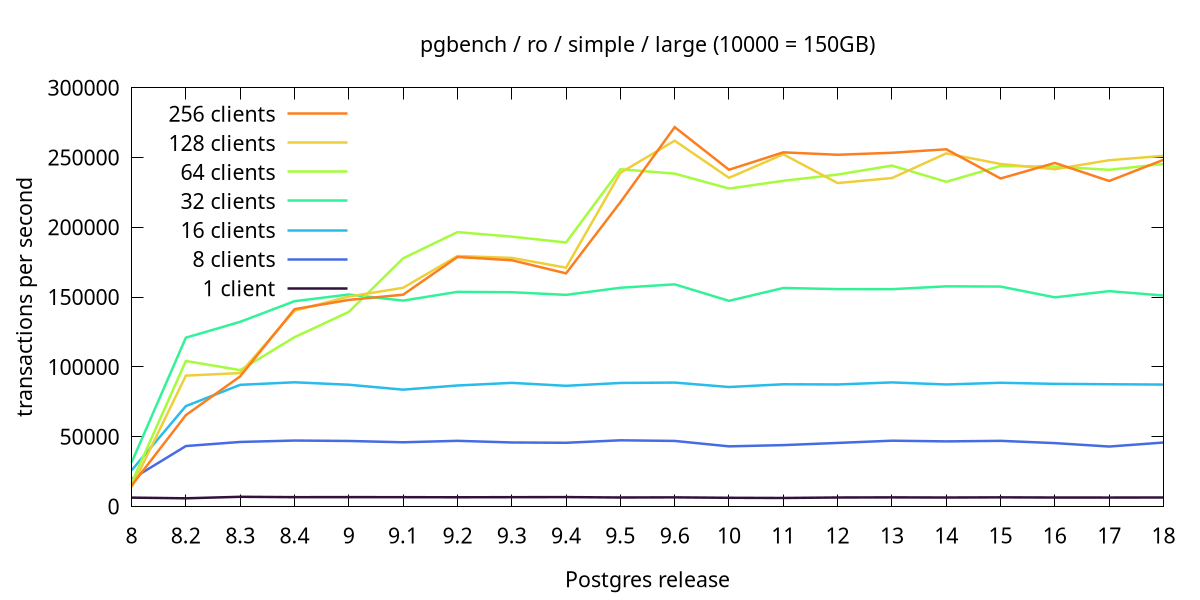
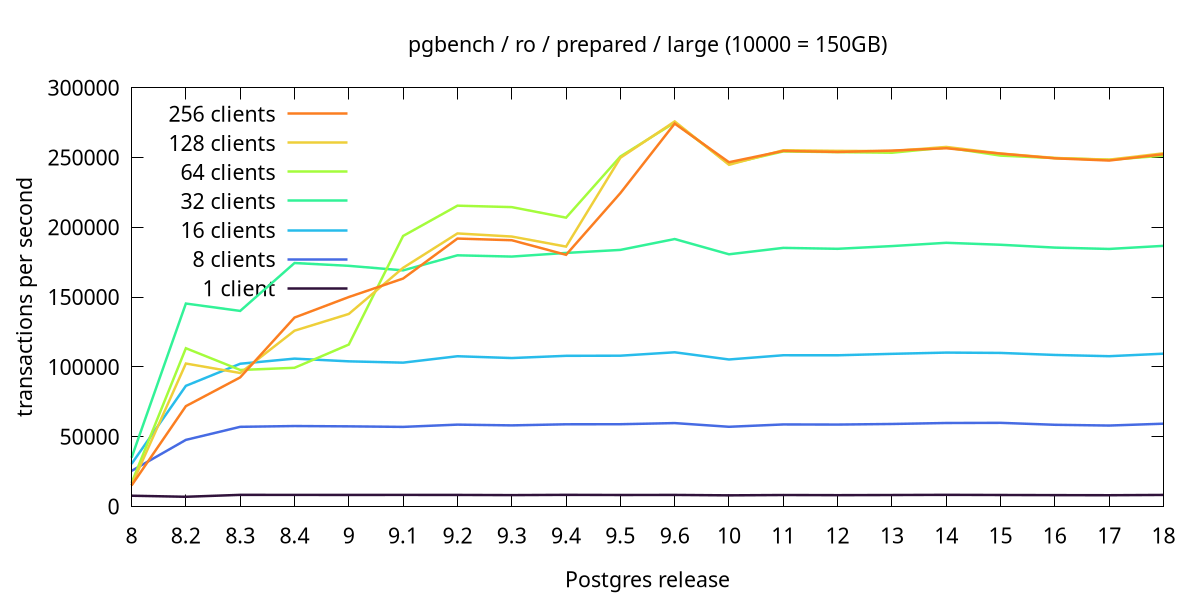
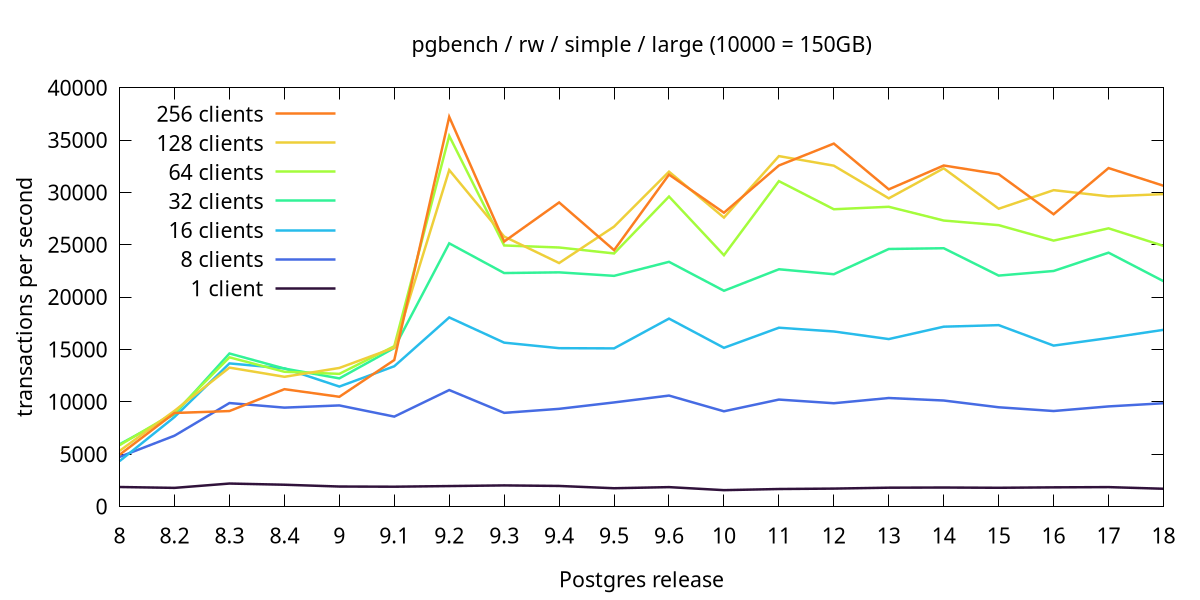
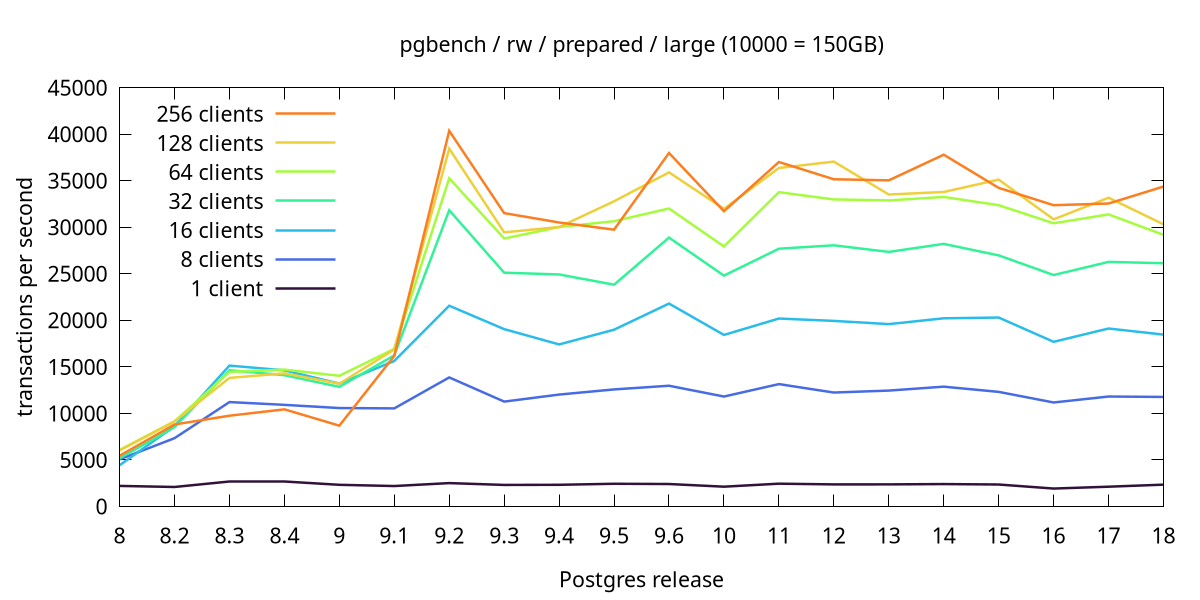
Pretty much everything about the medium scale could be repeated here for the large scale - both for the read-only and read-write results. Gradual improvements for releases up to Postgres 9.6, then the behavior is quite stable.
large / read-write
Main improvements
It wasn’t my ambition to identify individual patches improving performance. But looking at the charts it’s very clear most of the improvements happened in a handful of releases. And the release notes mention improvements related to scalability and multi-core systems:
Postgres 9.2: Allow uncontended locks to be managed using a new fast-path lock mechanism
Postgres 9.5 and 9.6: Substantial performance improvements, especially in the area of scalability on multi-CPU-socket servers
Postgres 14: Improve the speed of computing MVCC visibility snapshots on systems with many CPUs and high session counts (Andres Freund)
Postgres 18dev: Increase the number of fast-path lock slots
The newer releases (starting with 12) have links to relevant commits, in case you want to take a look at the actual code.
Conclusions
What improvements can we expect in the future? We seem to be past the period of explosive speedups when the performance improves by at least a factor of 2 (or even by an order of magnitude). We’ve seen that in 9.5/9.6, but since then the improvements were only incremental.
That does not mean improvements are not possible, but it’s a matter of economy. The amount of work needed for a “unit of improvement” got much higher, and developers are choosing to invest time elsewhere. It’s reasonable to expect this trend to continue, i.e. we will see only modest incremental improvements.
But every time I suggested I don’t expect to see yet another significant improvement for a particular workload in the past, someone quickly proved me wrong by posting a patch doing just that. Often it was Andres, and I suspect he might be about to do that again - go and watch his talk about NUMA from pgconf.eu 2024.
Moreover, this does not necessarily apply to all OLTP workloads. The pgbench TPC-B workload is very simple, and does not involve any joins, unlike many real-world applications. Similarly, this benchmark did not use any declarative partitioning - which is becoming more popular. And for these cases workloads we can still get massive improvements. In fact, there are patches improving those cases.
