Performance archaeology: OLAP
A couple days ago I wrote about performance improvements on OLTP workloads since Postgres 8.0, released 20 years ago. And I promised to share a similar analysis about analytical workloads in a follow-up post. So here we go ;-) Let me show you some numbers from a TPC-H benchmark, with some basic commentary and thoughts about the future.
The OLTP post started by discussing the motivation for running these benchmarks, and why other sources of performance data (development benchmarks, application metrics) are not very useful. And whether such a comparison can even be “fair.” I’m not going to repeat all of that here, so maybe read that post first.
So let’s jump right to the benchmark details …
Hardware
Just like in the OLTP case, I wanted to make the benchmark as fair as possible, so I decided to use my smaller “i5” machine from ~2012:
- i5-2500k (4 cores / 4 threads)
- 16GB RAM
- 6x Intel DC S3700 100GB (SATA SSD, RAID0)
- Debian 12.7 (kernel 6.10)
- ext4
- gcc 12.2.0
It might seem a bit strange to use a machine that is much smaller than the one used for the OLTP benchmark. Analytical queries tend to be much more complex, process more data, and can benefit from parallelism (and thus from larger machines).
But this benchmark is not about peak performance. The goal is to compare performance with different releases. And that just requires using the same “reasonable” hardware. Yes, the CPU may be slower, but it’s slow for all releases.
For OLTP, a big question is scalability - the queries are tiny, and concurrency matters a lot. With analytical queries, it’s a very different story. Queries are much more expensive (CPU and/or I/O), so you can’t really run that many of them at the same time anyway.
In other words, concurrency does not matter that much. And without concurrency, there’s no need to use machines with many cores. Feel free to disagree, but I think using a smaller machine is fine.
Note: I’m sure you can come up with analytical workloads where concurrency does matter, but that’s not what this post is about. This is about the “simple” analytical workload.
TPC-H
There are multiple analytical benchmarks, but I think TPC-H is the gold standard. It’s widely known and used, so almost anyone is familiar with it. It’s also not overly complex - 22 queries of moderate complexity.
Even if you never saw TPC-H before, you should be able to read the specification and get it working in a day or two. Other benchmarks (like TPC-DS, a TPC-H successor) are much more complex.
To be clear, I’m not saying TPC-H is perfect - it certainly is not, and it has known weaknesses (e.g. uniform data distribution and access patterns). But for this comparison that’s fine.
I’ve heard suggestions that TPC-H is “too simple” because it only has 22 queries. Sure, it doesn’t benchmark everything - the queries don’t use features like CTEs, window functions, and so on. But it’s actually a pretty well-constructed benchmark, with each query focusing on a subset of “choke points” in the database engine.
There’s a great paper discussing this: TPC-H Analyzed: Hidden Messages and Lessons Learned from an Influential Benchmark by Peter Boncz, Thomas Neumann, and Orri Erling. I very much recommend reading it.
For this comparison, I opted to use a 10GB data set. That’s less than the 16GB RAM in the machine, but that’s the raw size. After importing and creating indexes it uses much more disk space. The tables alone use ~13GB of disk space, indexes take another 30GB (the schema is heavily indexed to allow index-only scans).
Finally, I’d like to point out it wasn’t my ambition to run “full” TPC-H. I only ran a data load (with creating indexes, foreign keys, …), and then timed the 22 queries. I have not done the various other bits in proper TPC-H, like “refreshes” of data, etc.
If interested, take a look at the scripts driving the benchmark, and the tpch-load.csv and tpch-queries.csv files with query timings. (The results also have data for a 1GB data set, but I’ll not cover that here. The charts look almost exactly the same.)
postgresql.conf
As mentioned in the OLTP post, the configuration defaults are rather conservative, far from optimal on modern hardware, and change over time. To make the comparison easier, I used the same configuration for all releases.
shared_buffers = 262143checkpoint_timeout = 1800max_connections = 1000random_page_cost = 2effective_io_concurrency = 16(since Postgres 8.4)effective_io_concurrency = 54(since Postgres 13)checkpoint_segments = 8192(until Postgres 9.4)max_wal_size = '128GB'(since Postgres 9.5)min_wal_size = '32GB'(since Postgres 9.5)cpu_index_tuple_cost = 0.005default_statistics_target = 100effective_cache_size = 16384maintenance_work_mem = 65536wal_buffers = 512work_mem = 4096
I think this config is reasonable. An alternative would be to tune each individual release, but that would require a lot of time.
Anyway, enough talking. Let’s look at some results ;-)
Data loads
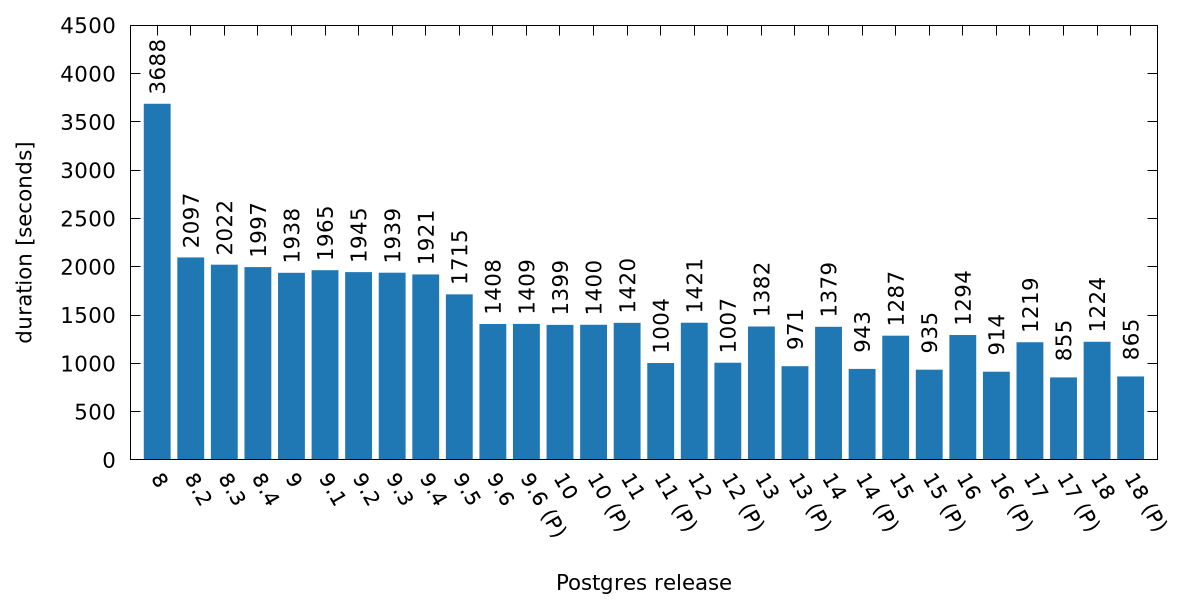
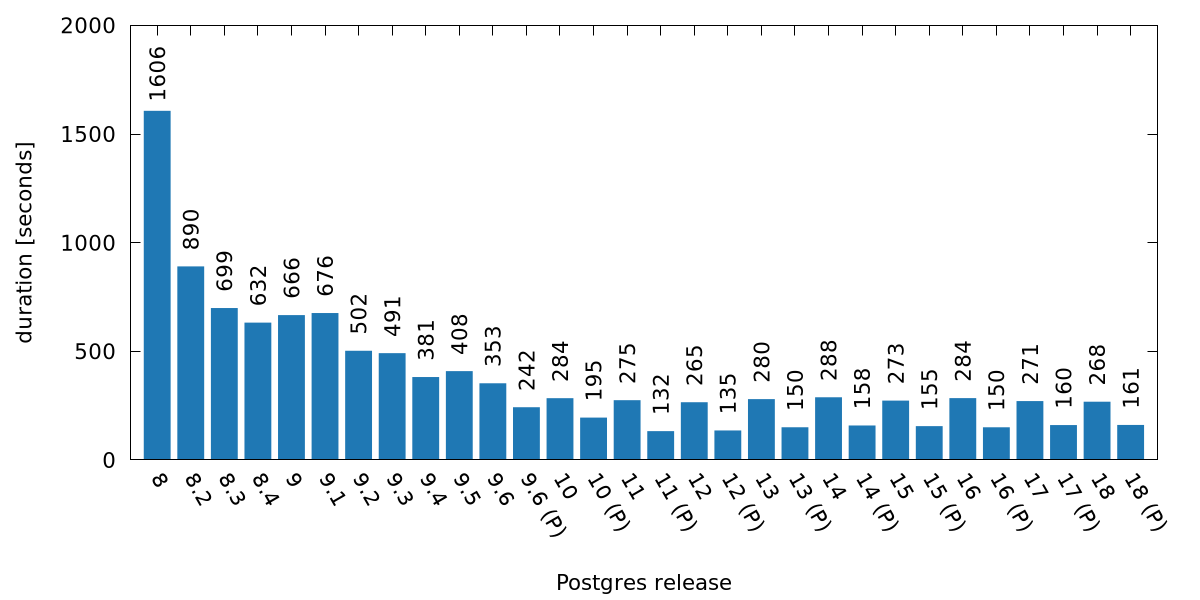
So how fast can we load large amounts of data? The timings of the whole load look like this:
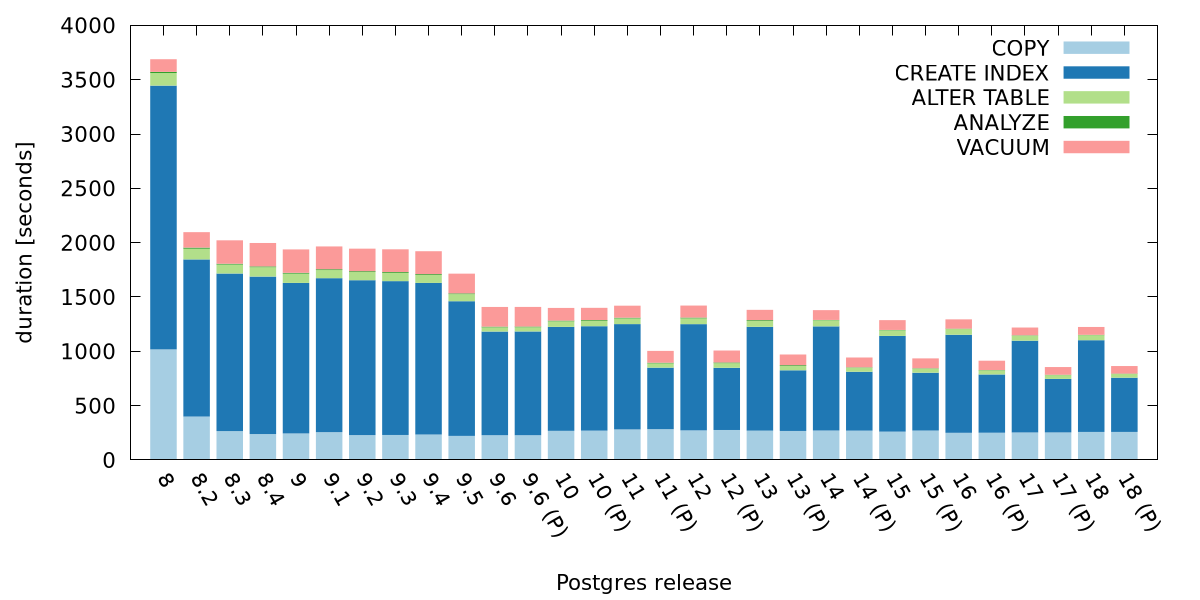
Those are some pretty significant improvements, especially in Postgres 8.2, 9.5 and 9.6. So which parts of the data load did improve?
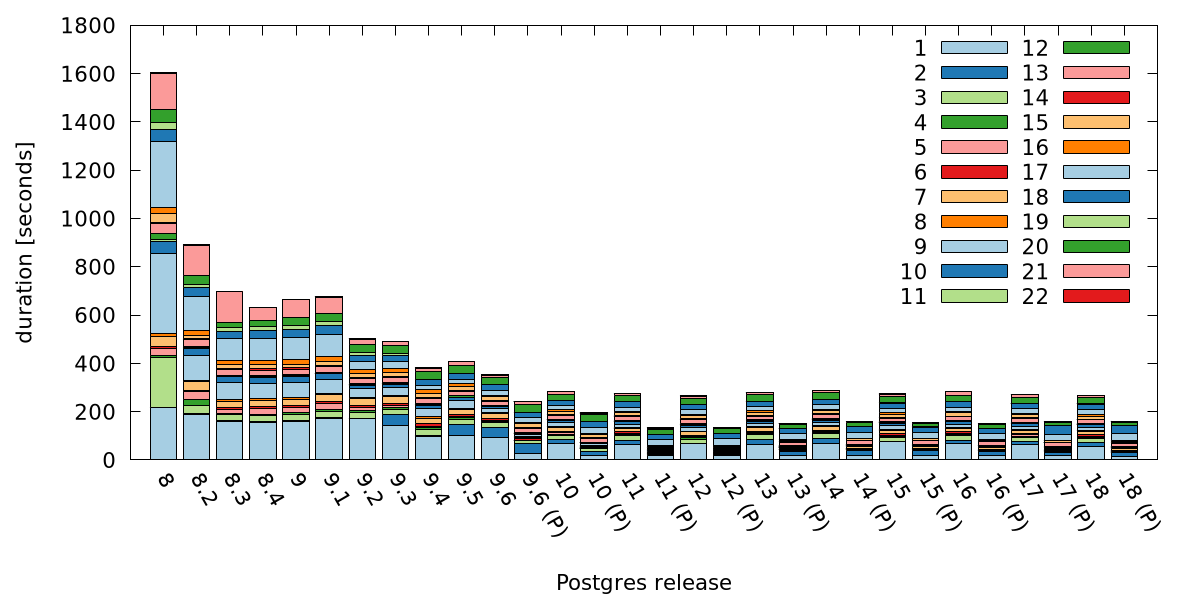
Between 8.0 and 8.3, the main improvement is clearly in COPY, and then
also in CREATE INDEX phases. Those are the parts that clearly dominate
the timing, so that makes sense.
Then in 9.5/9.6 we get significant improvements in CREATE INDEX. I’d
bet those are thanks to improvements in sorting.
Since then it’s been rather steady - no major speedups or slowdowns. The
one exception is that since Postgres 11 we can do parallel
CREATE INDEX.
Queries / Uncached
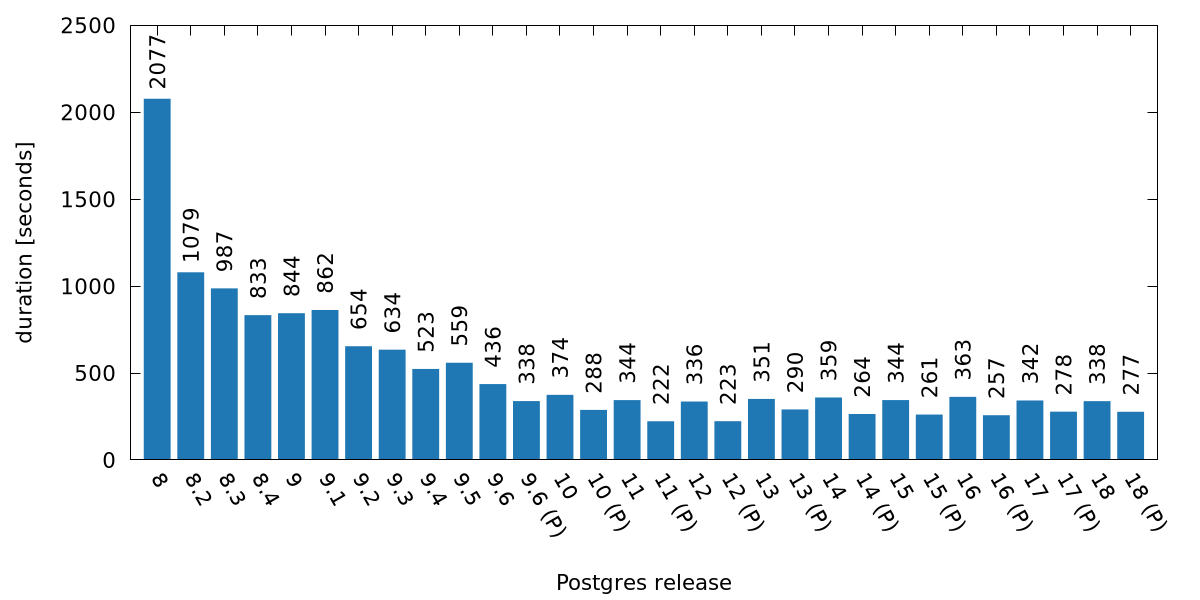
What about the queries? First let’s look at timings for the “uncached” case. That means the instance gets restarted (which clears shared buffers), and the page cache is dropped (which clears filesystem cache). So none of the data is in memory before running a query. The total duration (for all 22 queries combined) looks like this:
Pretty massive improvement between Postgres 8.0 and 8.2 (it might be in 8.1, I don’t know), followed by steady improvements until Postgres 9.6. And then it’s mostly steady, except for parallelism in every other run.
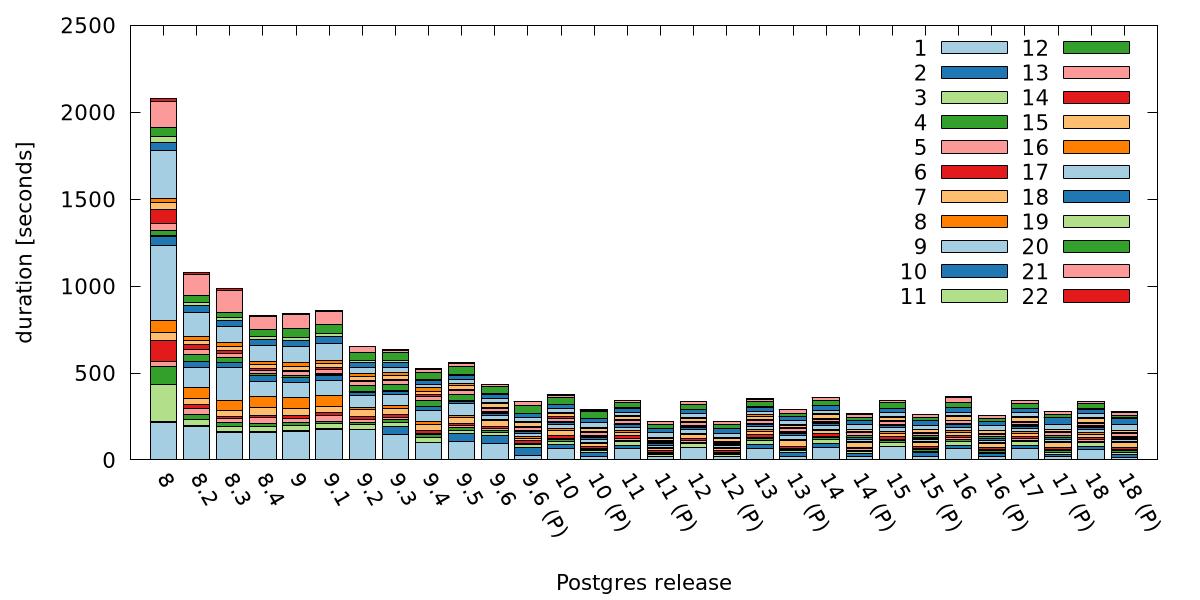
How are individual queries performing? Maybe the duration is dominated by one very long query? Here’s the timing for individual queries.
Initially there were several fairly expensive queries (Q1, Q3, Q9 and Q17 are standing out in Postgres 8.0), but over time all those queries got much faster. The only exception remains to be Q1 - it’s essentially a huge aggregate, so there’s not much we can do.
Queries / Cached
In the “cached” case, queries are executed for a second time, so we expect to find most of the data already in memory. Not necessarily in shared buffers, but still in memory, eliminating a lot of the I/O. The chart of total duration looks very similar. It’s faster, but the overall shape is pretty much the same as for “uncached” runs.
The chart with timing of queries is very similar too, but there are some interesting differences.
Most of the queries that dominated the “uncached” chart (e.g. Q6 or Q17 in Postgres 8.0) are almost invisible in the “cached” runs. That implies those queries are particularly sensitive to I/O.
Still, the overall shape is pretty close to the “uncached” chart.
Regressions?
While analyzing results from early benchmark runs, I noticed multiple cases where the performance got worse. We might call that a regression, but the reality is somewhat more complicated - most of the issues turned out to be expected consequences of intentional changes, not bugs.
For example, TPC-H queries are complex - not extremely, but much more complex than the OLTP queries. This means the optimizer has to consider a lot of ways to execute the query, and that makes it harder to pick the really best plan.
But why would a new release pick a different query plan? There are many
reasons why that could happen. Perhaps the release introduced a new way
to execute the query. A good example of that is “Incremental Sort”
introduced in PG13, which is great - it allows exploiting partially
sorted inputs, instead of forcing a full sort. And most of the time that
works perfectly fine, improving performance. But it may misbehave with
data skewed in certain ways (especially for queries with a LIMIT
clause), or may amplify the impact of the issue.
However, most of the cases I investigated were actually due to changes of default values for GUCs, affecting the costing model. Which in turn affects plan selection.
effective_cache_size- This hint is used to estimate how much data is cached (in shared buffers or page cache). The higher the value, the cheaper random I/O is expected to be. And that means the planner is more likely to pick e.g. index scans.effective_io_concurrency- This option determines how much data to prefetch (in plans that support it). However, Postgres 14 changed how this is used, which resulted in much lower effective prefetch distance. Depending on storage the impact may be significant.foreign-key join estimates - Not a GUC, but this feature improves cardinality estimates. It’s natural to assume that better estimates result in more accurate costing and thus better query plan. But it can happen that the original plan (with bad estimates) was actually better by chance. And fixing the estimate makes it worse.
Luckily, in all those cases it’s possible to simply adjust the config
a bit, which fixes the regression. Either the GUC that changed (e.g.
updating effective_io_concurrency to increase the prefetch distance),
or some related option (like random_page_cost).
We try hard to prevent regressions, but in some cases it’s not entirely avoidable. Otherwise we wouldn’t be able to adjust the defaults, introduce new plan options, and so on. In fact, we change the defaults exactly to affect planning.
The main takeaway is that it’s important to have a way to validate performance after deploying a new major release. It might be a basic monitoring (e.g. latencies on some internal API), an application benchmark performed on a DEV environment before going live, or something else. Just don’t blindly assume regressions can’t happen.
Main improvements
It’s not my ambition to point at individual commits improving the performance. There’s literally thousands of such commits over the years, and it’s not practical to isolate them. But if you look at the charts, there are several releases with a clear “step” improvement.
After looking at the plans and release notes a bit, I think the improvements with the most impact were:
- Postgres 8.1: bitmap index scans
- Postgres 8.4: read-ahead (prefetching) for bitmap index scans
- Postgres 9.2: index-only scans
- Postgres 9.6 (and later): parallelism (queries,
CREATE INDEX, etc.)
Since Postgres 11 the performance (both for data loads and queries) is mostly unchanged. It might be a bit different on big boxes with many cores and significant concurrency, but maybe not - otherwise we would see changes on OLTP too.
I have tested with JIT, but the results were a bit disappointing. There was a benefit, but it was very modest - maybe 5% or so, and hard to predict. Perhaps it’d help more with a newer CPU, or maybe it was due to schema heavily optimized for index-only scans. Not sure.
I think it’s reasonable to expect mostly smaller/incremental changes
from now on. We might see new features (e.g parallel COPY) and other
improvements, but those are unlikely to result in massive speedups.
We’re in the land of diminishing returns, where we need to invest more
and more development resources to get the same benefit.
The low-hanging fruit is mostly gone …
Future improvements?
I think that substantial improvements will require major changes. All modern analytical databases rely on columnar storage and an executor leveraging that (by vectorization, late materialization, execution on compressed data, …).
There were attempts to implement some of that in Postgres (e.g. zedstore), but AFAIK none of that is still being worked on. It might be time to revive those projects? Yes, it’s a significant change of architecture, and it’s especially demanding if it needs to be done without causing trouble to existing users and OLTP workloads.
But it seems there might be a radically different new approach. There are several attempts to use Postgres as an interface, but offloading analytical queries to specialized engines processing data in formats like Parquet/Arrow, or even Postgres data files. We’ll see.
