Playing with BOLT and Postgres
A couple days ago I had a bit of free time in the evening, and I was bored, so I decided to play with BOLT a little bit. No, not the dog from a Disney movie, the BOLT tool from LLVM project, aimed at optimizing binaries. It took me a while to get it working, but the results are unexpectedly good, in some cases up to 40%. So let me share my notes and benchmark results, and maybe there’s something we can learn from it. We’ll start by going through a couple rabbit holes first, though.
I do a fair amount of benchmarking during development, to assess impact of patches, compare possible approaches, etc. Often the impact is very clear - the throughput doubles, query that took 1000 milliseconds suddenly takes only 10 milliseconds, and so on. But sometimes the change is tiny, or maybe you even need to prove there’s no change at all.
That sounds trivial, right? You just run the benchmark enough times to get rid of random noise, and then compare the results. Sadly, it’s not that simple, and it gets harder the closer the results are. So in a way, proving a patch does not affect performance (and cause regression) is the hardest benchmarking task.
Binary layout matters
It’s hard because of “binary layout” - layout of data structures, variables and functions etc. in the executable binary. We imagine the executable gets loaded into memory, and that memory is uniformly fast. And it’s not, we just live in the illusion of virtual address space. But it’s actually backed by a hierarchy of memory types with vastly different performance (throughput, latency, energy costs, …). There’s a wonderful paper by Ulrich Drepper from 2007, discussing all this. I highly recommend reading it.
This means the structure of the compiled binary matters, and maybe the patch accidentally changes it. Maybe the patch adds a local variable that shifts something just enough to not fit in the same cache line. Maybe it adds just enough instructions or data to push something useful from iTLB/dTLB caches on the CPU, forcing access to DRAM later. Maybe it even affects branch prediction, or stuff like that.
These random changes to binary layout have a tiny impact - usually less than 1% or so, perhaps a bit more (say 5%?). I’m sure it’s possible to construct artificial examples with much bigger impact. But I’m talking about impact expected on “normal” patches.
To further complicate things, these layout effects are not additive. If you have two patches causing “1% regression” each because of layout, it does not mean applying both patches will regress by 2%. It might be 0% if the patches cancel out, for example.
When you benchmark a patch, and the difference is less than ~1%, it’s hard to say if it’s due to the patch or a small accidental change to the binary layout.
But we would like to know! 1% regression seems small, but if we happen to accept multiple of those, the total regression could be much worse.
What can we do about it?
Stabilizer
There’s a great “Performance Matters” talk about this very issue, by Emery Berger, presented at StrangeLoop 2019. It starts by explaining the issue - and it does a much better job than I did here. And then presents the Stabilizer profiler, randomizing the binary layout to get rid of the differences.
The basic idea is very simple - the binary layout effects are random and should cancel out in the long run. Instead of doing many runs with a single fixed binary layout for a given executable, we can randomize the layout between runs. If we do that in a smart way, the effects will cancel out and disappear - magic.
Sadly, the Stabilizer project seems mostly inactive . The last commit touching code is from 2013, and it only supports LLVM 3.1 and GCC 4.6.2. Those are ancient versions. I don’t even know if you can build Postgres with them anymore, or how different the binary would be, compared to current LLVM/GCC versions.
Note: I wonder if it would be possible to do “poor man’s Stabilizer” by randomly adding local variables to functions, to change the size of the stacks. AFAIK that’s essentially one of the things Stabilizer does, although it does it in a nice way at runtime, without rebuilds.
BOLT
While looking for tools that might replace Stabilizer, I realized that randomizing the layout may not be the only option. Maybe it would be possible to eliminate the random effects by ensuring the binary layout is “optimal” in some way (hopefully the same for both builds).
I don’t recall how exactly, but this eventually led me to BOLT, which started as a research project at META. There’s a nice paper explaining the details, of course.
Dealing with binary layout differences for benchmarking is not the goal of BOLT, it’s meant to optimize the binary layout based on a profile. But my hope was that if I optimize the builds (unpatched and patched) the same way, the differences will not matter anymore.
So I decided to give it a try, and do some quick testing …
What didn’t quite work
The first thing I tried was simply installing bolt-16 (my machines are
running Debian 12.7), and followed the instructions from the README.
That seemed to work at first, but I quickly started to run into various
problems.
BOLT requires builds with relocations enabled, so that it can reorganize the binary. So make sure you build Postgres with
LDFLAGS="-Wl,--emit-relocs"
Collecting the profile is pretty simple, but that’s just regular perf
(the $PID is a Postgres backend running some queries):
perf record -e cycles:u -j any,u -p $PID -o perf.data
But then turning that into BOLT profile started to complain:
$ perf2bolt-16 -p perf.data -o bolt.data /mnt/data/builds/master/bin/postgres
BOLT-INFO: shared object or position-independent executable detected
perf2bolt-16: WARNING: reading perf data directly is unsupported, please use
 -aggregate-only or perf2bolt.
!!! Proceed on your own risk. !!!
PERF2BOLT: Starting data aggregation job for perf.data
PERF2BOLT: spawning perf job to read branch events
...
I’m just running the command the README tells me to, so I’m not sure
why it’s complaining about “reading perf data directly” or recommending
me to run the tool I’m actually running (maybe it’s checking the name
somehow, and the “-16” confuses that check somehow?).
It does produce the bolt.data file with BOLT profile, though. So let’s
try optimizing the binary using it:
$ llvm-bolt-16 /mnt/data/builds/master/bin/postgres -o postgres.bolt \
  -data=bolt.data -reorder-blocks=ext-tsp -reorder-functions=hfsort \
  -split-functions -split-all-cold -split-eh -dyno-stats
BOLT-INFO: shared object or position-independent executable detected
BOLT-INFO: Target architecture: x86_64
BOLT-INFO: BOLT version: <unknown>
BOLT-INFO: first alloc address is 0x0
BOLT-INFO: creating new program header table at address 0xa00000, offset 0xa00000
BOLT-INFO: enabling relocation mode
BOLT-INFO: enabling lite mode
BOLT-INFO: pre-processing profile using branch profile reader
ERROR: no valid profile data found
BOLT-ERROR: 'cannot pre-process profile': Input/output error.
I have no idea what’s wrong here. The perf2bolt-161 command clearly
produced a file, it’s a valid ELF file (readelf can dump it), but it
just doesn’t work for some reason.
Maybe there’s some problem with perf2bolt-16 after all? The README
does mention it’s possible to instrument the binary to collect the
profile directly, without using perf, so let’s try that:
$ llvm-bolt-16 /mnt/data/builds/master/bin/postgres \
               -instrument \
               -o /mnt/data/builds/master/bin/postgres.instrumented
BOLT-INFO: shared object or position-independent executable detected
BOLT-INFO: Target architecture: x86_64
...
BOLT-ERROR: library not found: /usr/lib/libbolt_rt_instr.a
Well, that didn’t work all that well :-( After a while I realized the library exists, but is in a different directory, so let’s create a symlink and try again:
# ln -s /usr/lib/llvm-16/lib/libbolt_rt_instr.a /usr/lib/libbolt_rt_instr.a
Now the instrumentation should work - run the -instrument command
again, and it’ll produce binary postgres.instrumented. Copy it over
the original postgres binary (but keep the original build, you’ll
need it for the actual optimization), start it, and run some queries.
It will create a profile in /tmp/prof.fdata, which you can use to
optimize the original binary:
$ llvm-bolt-16 /mnt/data/builds/master/bin/postgres.orig \
    -o /mnt/data/builds/master/bin/postgres.optimized \
    -data=/tmp/prof.fdata -reorder-blocks=ext-tsp \
    -reorder-functions=hfsort -split-functions -split-all-cold \
    -split-eh -dyno-stats
And this mostly works. I occasionally got some strange segfault crashes that seemed like an infinite loop. It seemed quite fragile (you look at it wrong, and it crashes). Maybe I did something wrong, or maybe the multi-version packages are confused a bit.
Making it work better
Issues with older LLVM builds are not a new thing, especially for relatively new projects like BOLT. The Debian version is from 16.0, while the git repository is on 20.0, so I decided to try a custom build, hoping it will fix the issues. It might also improve the optimization, of course.
First, clone the LLVM project repository, then build the three projects
needed by BOLT (this may take a couple hours), and then install it into
the CMAKE_INSTALL_PREFIX directory (you’ll need to adjust the path).
$ git clone https://github.com/llvm/llvm-project.git

$ cd llmv-project

$ cmake -S llvm -B build -G Ninja -DCMAKE_BUILD_TYPE=Release \
        -DLLVM_ENABLE_PROJECTS="bolt;clang;lld" \
        -DCMAKE_INSTALL_PREFIX="/home/tomas/tools"

$ cmake --build build

$ cmake --install build
This custom build seems to work much better. I’m yet to see segfaults,
the problems with missing library and input/output errors when
processing perf data went away too.
At some point I ran into a problem when optimizing the binary, when
llvm-bolt fails with an error:
BOLT-ERROR: unable to get new address corresponding to input address
            0x2a5185 in function ExecInterpExpr/1(*2). Consider adding
            this function to --skip-funcs=...
I don’t know what this is about exactly, but adding this option seems to have fixed it:
-skip-funcs=ExecInterpExpr.*
I’m not sure this is a good solution, though. This function is for the expression interpreter, and that’s likely one of the hottest functions in the executor. So not optimizing it may limit the possible benefits of the optimization for complex (analytical) queries.
Results
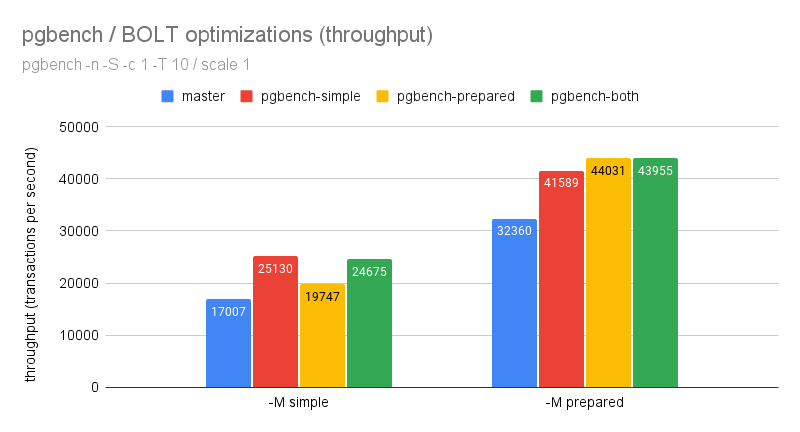
To measure the impact of BOLT optimization, I ran a couple traditional benchmarks - pgbench for OLTP, and the TPC-H queries for OLAP. I expect the optimizations to help especially CPU intensive workloads, so I ran the benchmarks on small data sets that fit into memory. That means scale 1 for pgbench, 10GB for TPC-H.
I always compared a “clean” build from the master branch, with a build optimized using BOLT. The profile used by BOLT was collected in various ways - how important the specific profile matters is one of the questions. I assume it matters quite a bit, because optimizing based on a profile is the main idea in BOLT. If it didn’t make a difference, why bother with a profile at all, right? We could just use a plain LTO.
OLTP / pgbench
First, let’s look at simple read-only pgbench, with a single client, that is
$ pgbench -n -S -c 1 -M [simple|prepared] -T 15 db
on regular build (labeled “master”), and then builds optimized using
profiles collected for various pgbench workloads:
- pgbench-simple - profile for
pgbench -S -M simple - pgbench-prepared - profile for
pgbench -S -M prepared - pgbench-both - simple/prepared profiles, combined by
merge-fdata
The results (throughput in transactions per second, so higher values are better) look like this:
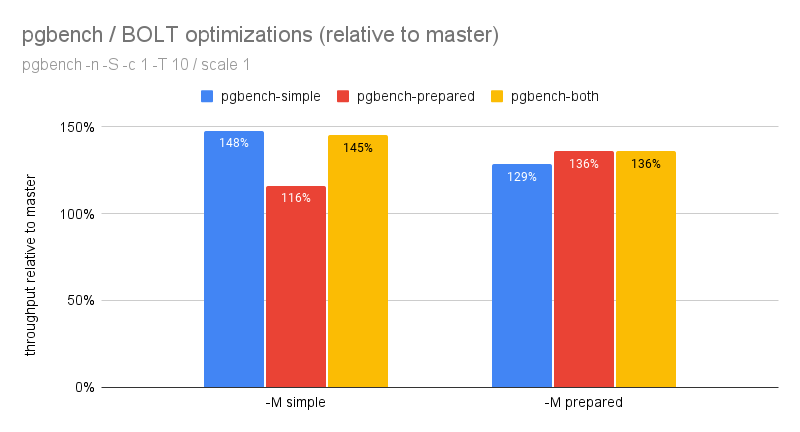
Or relative to “master” you get this:
Those are pretty massive improvements. Read-only pgbench is a very
simple workload, we’ve already optimized it a lot, it’s hard to improve
it significantly. So seeing 30-40% improvements is simply astonishing.
There’s also the first sign that the actual profile matters. Running a
test with -M simple on a build optimized using the -M prepared
profile improves much less than with the -M simple profile.
Interestingly enough, for -M prepared there’s no such gap, likely
because the -M prepared profile is a “subset” of profile collected
for -M simple.
OLAP / TPC-H
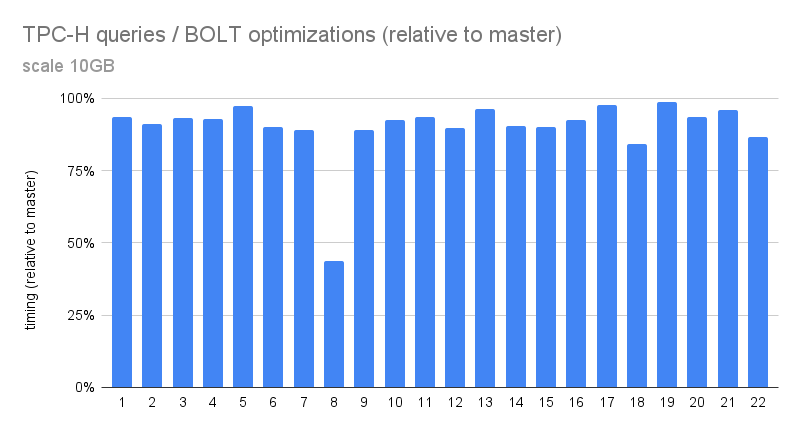
Let’s look at more complex queries too. I only took the 22 queries from the TPC-H benchmark, and ran those on a 10GB data set. For each query I measured the duration for a clean “master” build, and then also duration for a build optimized using a profile for that particular query.
The 22 queries take very different amounts of time, so I’m not going to compare the raw timings, just a comparison relative to a “master” build:
Most queries improved by 5-10%, except for queries 8 and 18, which improved by ~50% and ~15%. That’s very nice, but I have expected to see bigger improvements, considering how CPU intensive these analytical queries are.
I suspect this might be related to the -skip-funcs=ExecInterpExpr.*
thing. Complex queries with expressions are likely spending quite a bit
of time in the expression interpreter. If the optimization skips all
that, that doesn’t seem great.
Even so, 5-10% across the board seems like a nice improvement.
Cross-workload profiles
The natural question is how important the optimization profile is, and
how it affects other workloads. I already touched on this in the OLTP
section, when talking about using the -M prepared profile for
-M simple workload.
It might be a “zero-sum game” where a profile improves workload A, but then also regresses some other workload B by the same amount. If you only do workload A that might still be a win, but if the instance handles a mix of workloads, you probably don’t want this.
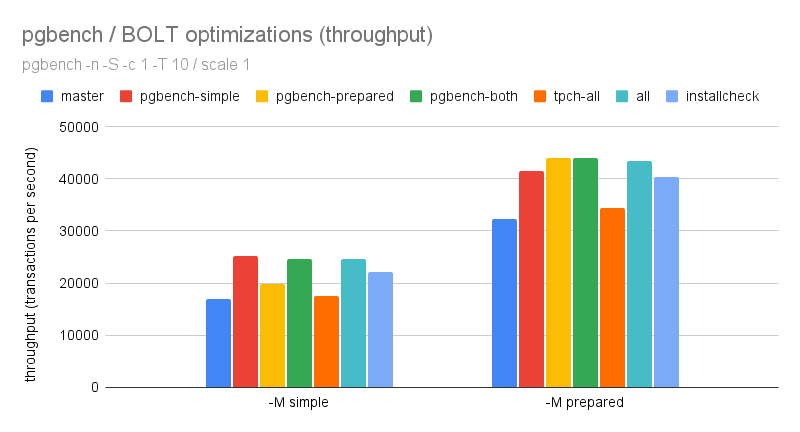
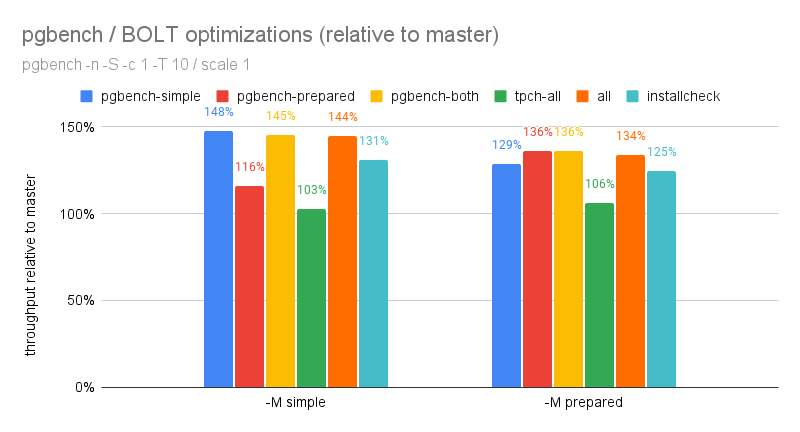
I did a couple more benchmarks, using profiles combined from the earlier “specific” profiles and also a generic “installcheck” profile:
- tpch-all - combines all the per-query profiles from TPC-H
- all - combines
tpch-allandpgbench-both(so “everything”) - installcheck - profile from running
make installcheck
The results for OLTP look like this:
The “all” profile combining profiles for the workloads works great,
pretty much the same as the best workload-specific profile. The profile
derived from make installcheck is a bit worse, but still pretty good
(25-30% gain would be wonderful).
Interestingly, none of the profiles makes it slower.
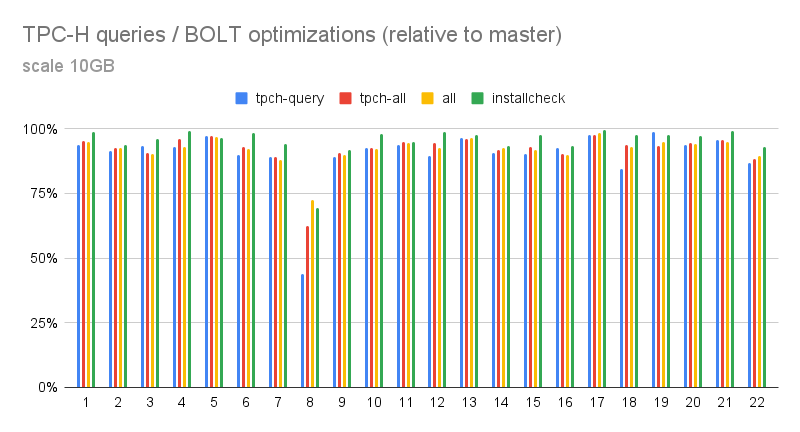
For TPC-H, I’ll only show one chart with the relative speedup for
tpch-all and all profiles.
The improvements remain quite consistent for the “tpch-all” and “all” profiles, although query 8 gets worse as the profile gets less specific. Unfortunately the “installcheck” profile loses about half of the improvements for most queries, except for query #8. The ~5% speedup is still nice, of course.
It would be interesting to see if optimizing the interpreter (i.e.
getting rid of -skip-funcs=ExecInterpExpr.*) makes the optimization
more effective. I don’t know what exactly the issue is or how to make
it work.
Is it correct?
There’s also the question of correctness. There were some recent discussions about possiblly supporting link-time optimization (LTO), in which some people suggested that we may be relying on files being “optimization barriers” in a couple places. And that maybe enabling LTO would break this, possibly leading to subtle hard-to-reproduce bugs.
The optimizations done by BOLT seem very similar to what link-time optimization (LTO) does, except that it leverages a workload profile to decide how to optimize for that particular workload. But if LTO may be incorrect, so would BOLT probably.
I’m no expert in this area, but but per the discussion in those threads it seems this may not be quite accurate. The “optimization barrier” only affects compilers, and CPUs can reorder stuff anyway. The proper way to deal with this are “compiler/memory barrier” instructions.
And some distributions apparently enabled LTO some time back, like Ubuntu in 22.04. And while it’s not a definitive proof of anything, we didn’t observe a massive influx of strange isses from them.
Conclusions
I started looking at BOLT as a way to eliminate the impact of random changes to binary layout during benchmarking. But I got distracted by experimenting with BOLT on different workloads etc. I still think it might be possible to optimize the builds the same way, and thus get rid of the binary layout impact.
It’s clear adjusting the binary layout (and other optimizations) can yield significant speedups, on top of the existing optimizations already performed by the compilers. We don’t see 30-40% speedups in pgbench every day, that’s for sure.
But there’s also a lot of open questions. The profile used for the optimization matters a lot, so how would we collect a good profile to use for builds?
The nice thing is that I haven’t really seen any regressions - none of the cases got slower even if optimizing using a “wrong” profile. That’s nice, as it seems regressions are not very common.
FWIW I doubt we would start using BOLT directly, at least not by default. It’s more likely we’ll use it to learn how to adjust the code and builds to generate a better executable. Is there a way to “reverse engineer” the transformations performed by BOLT, and deduce how to adjust the code?
