Fun and weirdness with SSDs
When I started working with Postgres (or databases in general) 25 years ago, storage systems looked very different. All storage was “spinning rust” - rotational disks with various interfaces (SATA/SAS/…) and speeds (7.2K/10k/15k/…). The spindle speed was the main performance determining feature, and everyone knew what IOPS and bandwidth to expect from a disk. The general behavior was pretty much the same.
With SSDs it’s more complicated. The interface may be the same, but the hardware “inside” the device can be very different. There’s nothing like the “spindle speed”, a single feature determining fundamental behavior. The flash memory is subject to various limits, but manufacturers may (and do) make different tradeoffs (much more cache, more spare space, etc.). And the hardware changes a lot over time too.
While working on the index prefetching patch, I ran into a couple weird differences between “very similar” queries. And we speculated it might be due to how SSDs handle the different I/O patterns. I did testing on my SSD devices, and there definitely are some very surprising differences in behavior, contradicting (reasonable) expectations. Let’s look at the results, and how it can result in strange query timings.
Note: I’m not suggesting the SSD characteristics are responsible for all the weird timings discussed in the prefetching patch. There seem to be some shortcomings in the AIO code too, with a proposed fix. But the SSD behavior does matter, and may affect even cases without AIO.
Devices
I have 5 different flash-based devices in my benchmarking machines:
- ryzen
- Samsung SSD 990 PRO 1TB (NVMe M.2, 4x, RAID0)
- INTEL SSDSC2BA10 (SATA III, 4x, RAID0)
- WD Blue SN5000 4TB (NVMe, M.2)
- xeon
- Samsung SSD 990 PRO 4TB (NVMe, M.2)
- WD Ultrastar DC SN640 960GB (NVMe, U.3)
The devices are a mix of different ages from multiple manufacturers. The “xeon” machine is old (~2016) and only has PCIe 3.0. “ryzen” is much newer and has PCIe 5.0, but the devices are still only PCIe 4.0.
If you want to try running this benchmark, here’s the scripts (with fio jobs) I used to run it, and also the raw results from both the ryzen and xeon.
The benchmarks were done both with buffered and direct I/O, with blocks from 1KiB to 8MB. There are three workloads - sequential read, sequential read in reverse direction, and random reads.
I’ll share only results for 1-256KiB, that’s where the interesting stuff happens. Postgres uses 8KiB blocks by default, but it’s useful to see the other block sizes for context.
The script also tests with libaio and io_uring engines, and there
are significant differences in some cases. I’ll show the io_uring
results, it’s the “more modern” engine, and it performs better.
Finally, the script runs with iodepth values 1, 16 and 128. I’ll show
results for iodepth=16, it matches the effective_io_concurency
default value in PG18. The iodepth=128 results are quite similar, and
iodepth=1 is not very representative of a typical Postgres
configuration.
Note: effective_io_concurency affects only operations that
support AIO / prefetching. Some operations still use only regular
synchronous I/O, which behaves close to iodepth=1.
Assumptions
Let’s spell out a couple high-level expectations first, before looking at the charts. I started benchmarking with these three assumptions:
- random I/O can get close to sequential I/O
- sequential I/O is still faster that random I/O
- the direction of the sequential scan does not matter
I still think all three points are fairly reasonable.
Buffered I/O
Let’s look at buffered I/O first. Most Postgres instances run with buffered I/O, the direct I/O support is still an experimental feature.
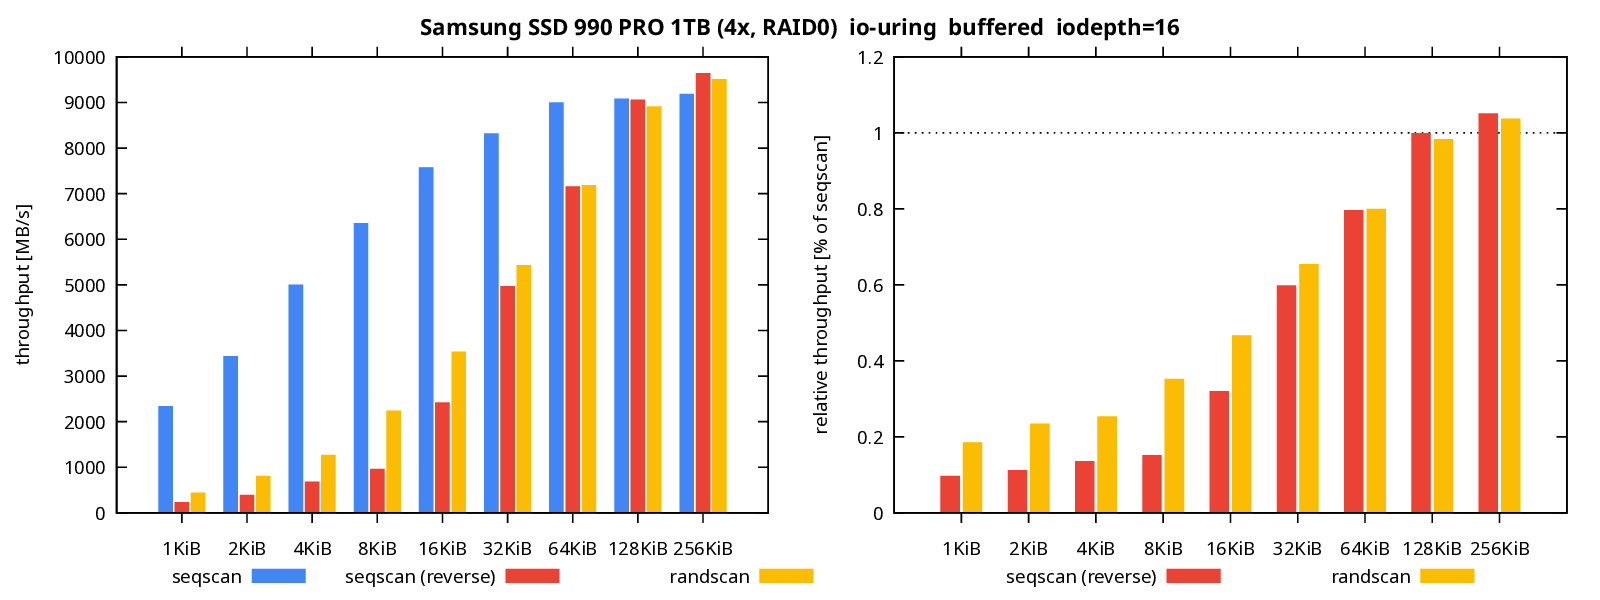
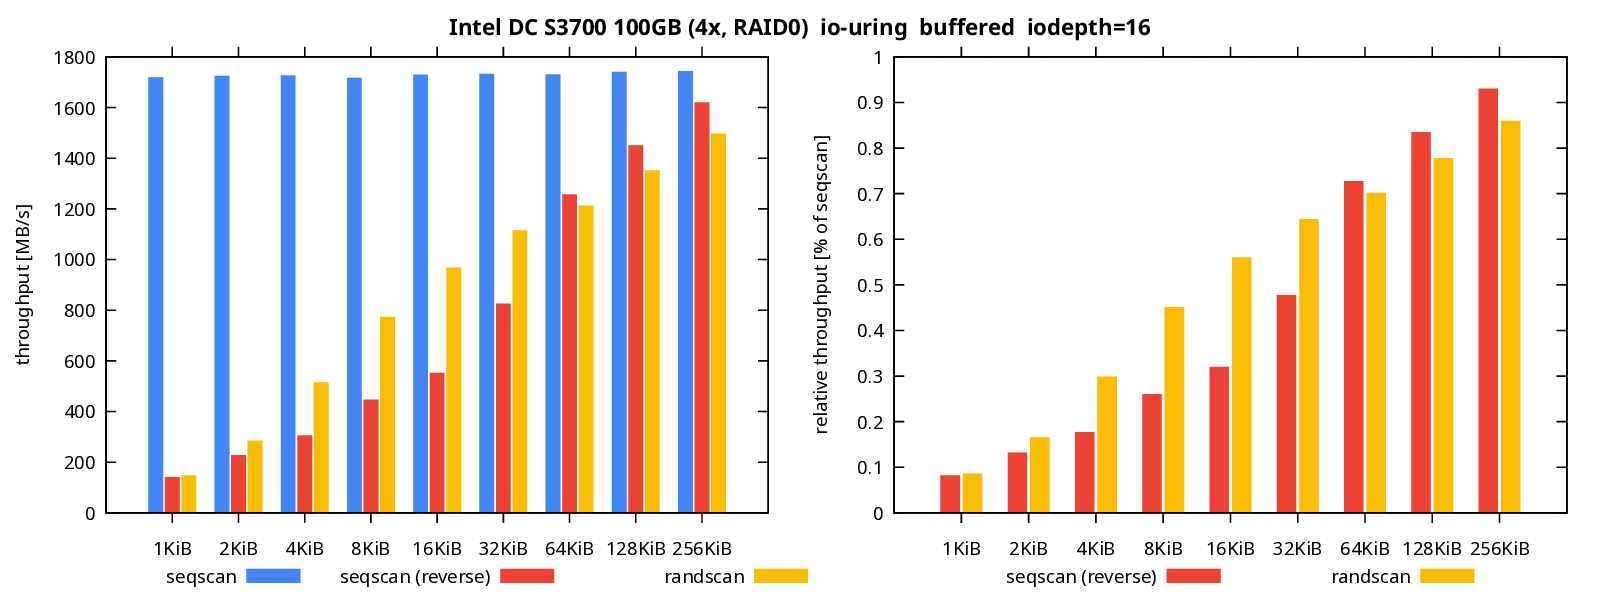
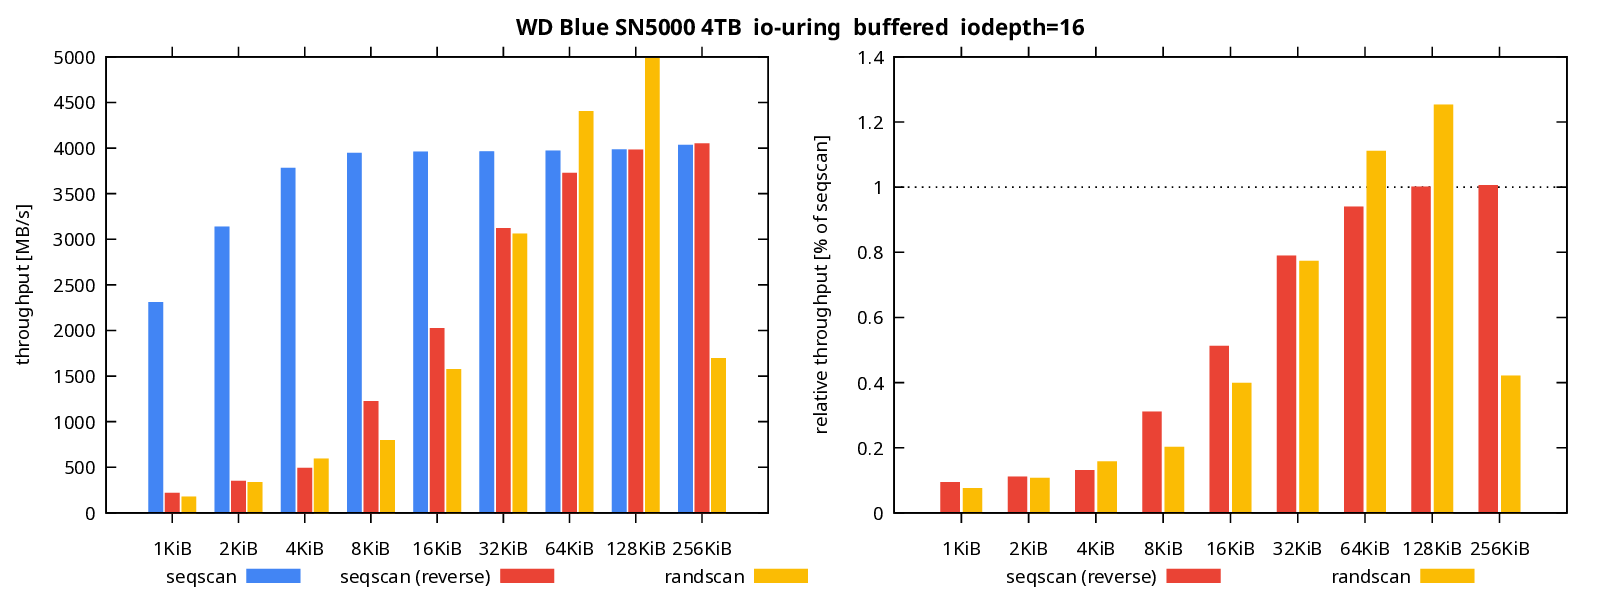
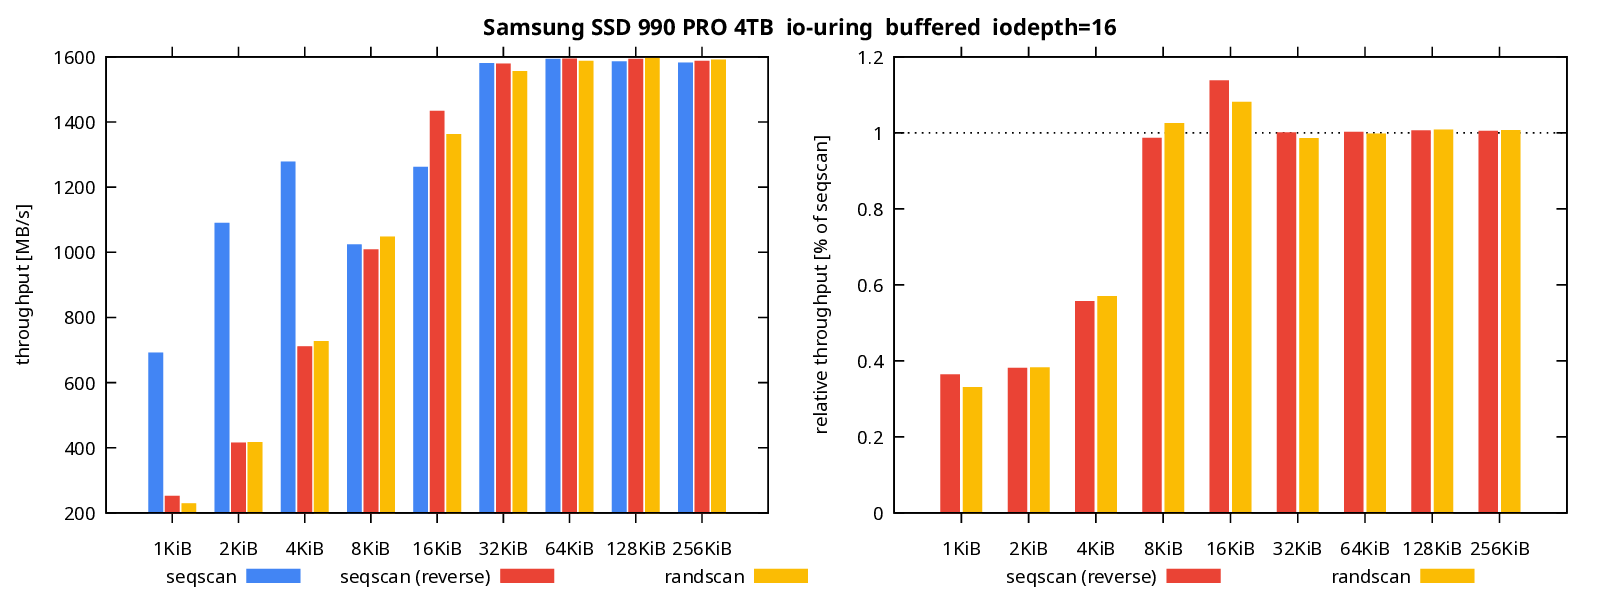
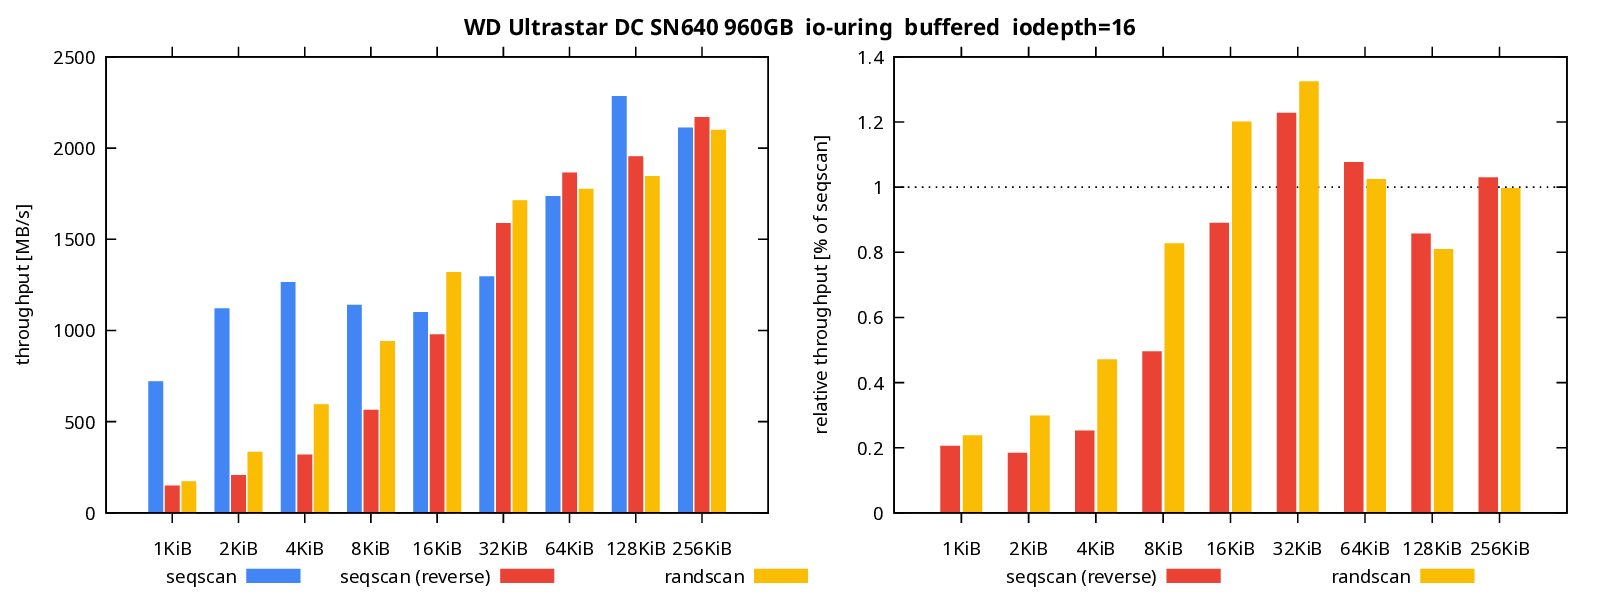
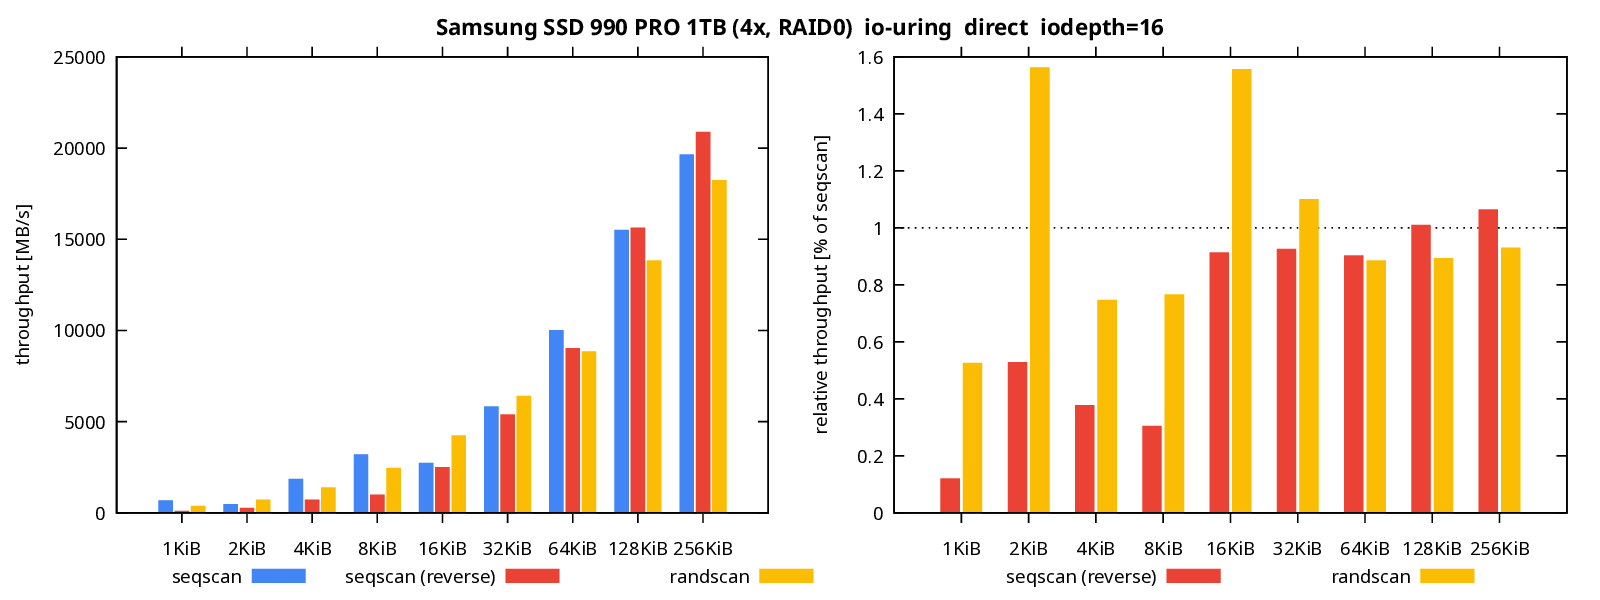
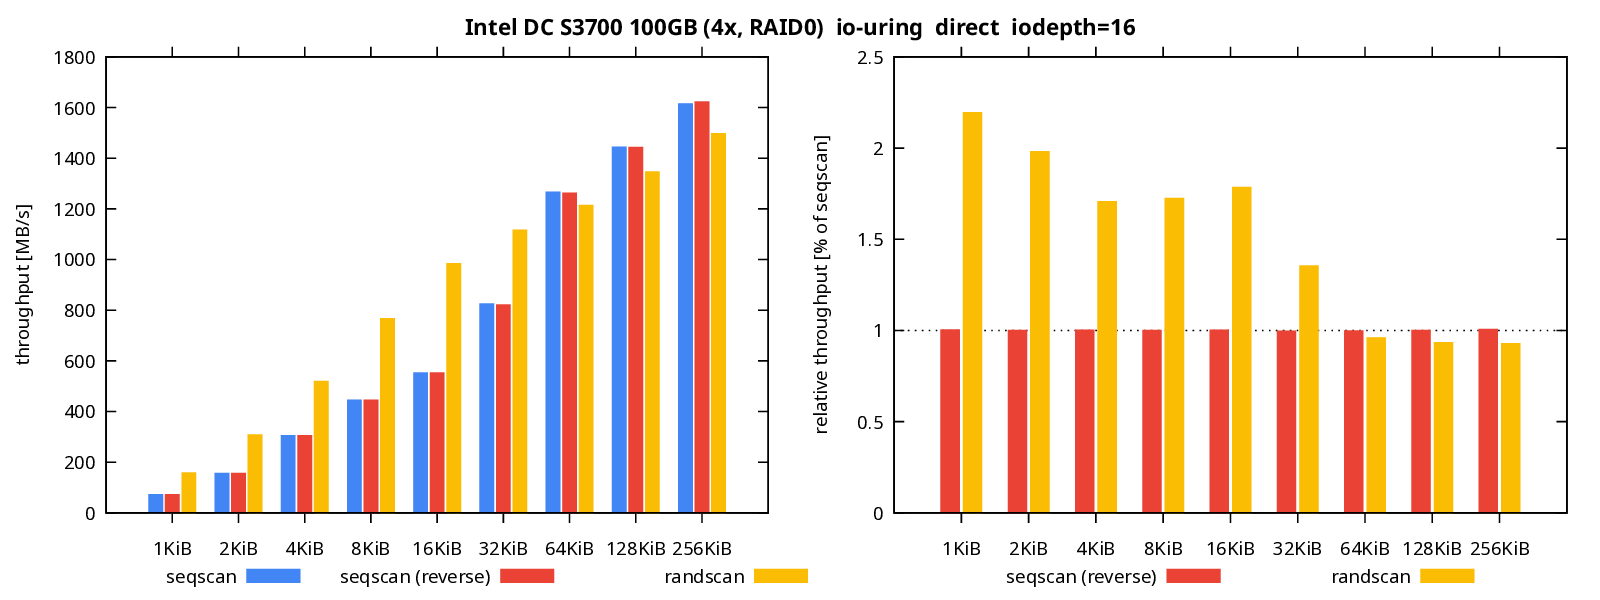
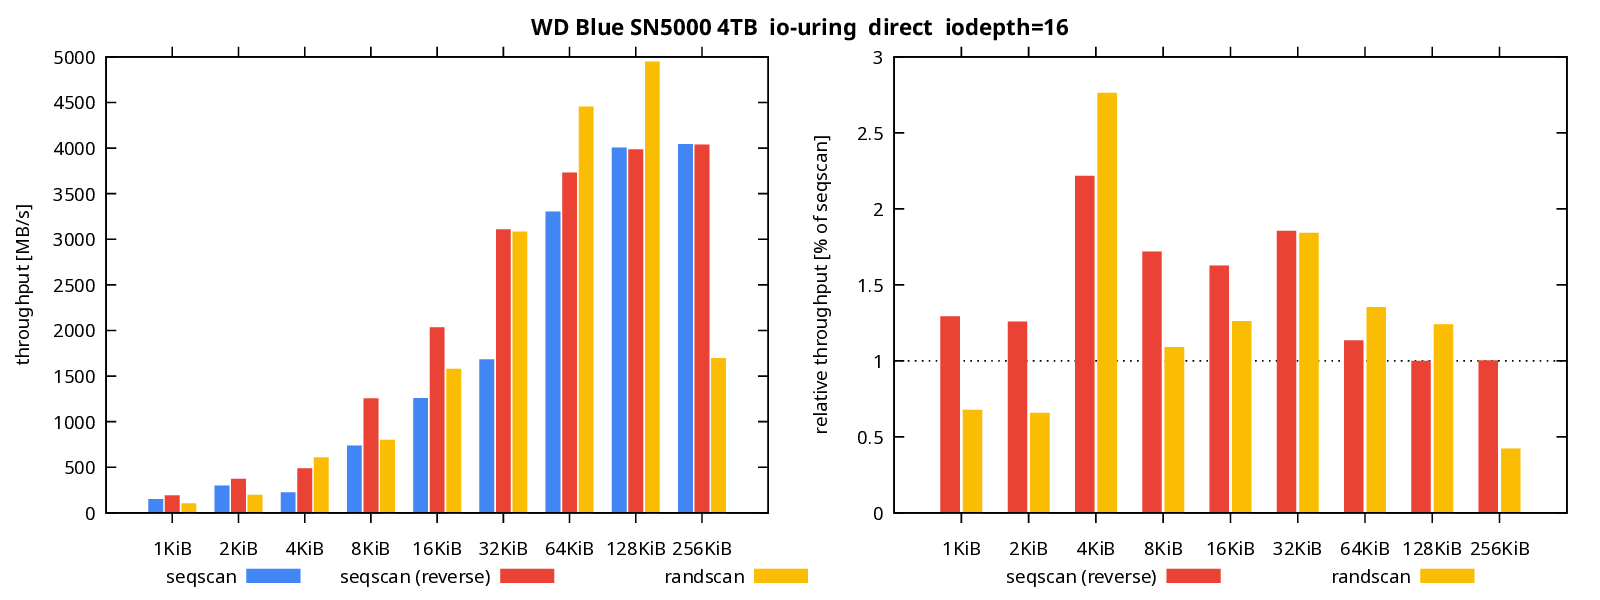
Each chart shows results for one device, with two plots. The plot on the left shows absolute throughput in MB/s, while the plot on the right shows throughput relative to sequential scan. There’s a dashed line at 1.0, which means “same throughput as sequential scan.”
I’m not going to discuss the results for each drive, that’d be very repetitive. Instead, there’s an “analysis” section for all the buffered I/O results.
Samsung SSD 990 PRO 1TB (NVMe M.2, 4x, RAID0)
INTEL SSDSC2BA10 (SATA III, 4x, RAID0)
WD Blue SN5000 4TB (NVMe, M.2)
Samsung SSD 990 PRO 4TB (NVMe, M.2)
WD Ultrastar DC SN640 960GB (NVMe, U.3)
Analysis
There’s a lot of variability between the different drives, but it’s clear some of these results contradict the assumptions.
The direction of the sequential read matters a lot. At 8KiB blocks the reverse read is about 3-4x slower than forward reads, and for smaller blocks is up to ~10x slower. That’s a huge difference, and I’ll show some queries affected by this later.
What could be causing this? With buffered I/O we get read-ahead, and it seems to detect sequential patterns only in the forward direction. The reverse direction is not detected, and there’s no read-ahead, which negatively affects throughput.
The assumption that random I/O is slower than sequential I/O is mostly
true, at least for forward sequential reads. There are many cases where
a random I/O is much faster than reverse sequential scans. This happens
only with enough I/O concurrency, not with iodepth=1, which makes it
hard to hit with current code, because index scans don’t use AIO yet.
Direct I/O
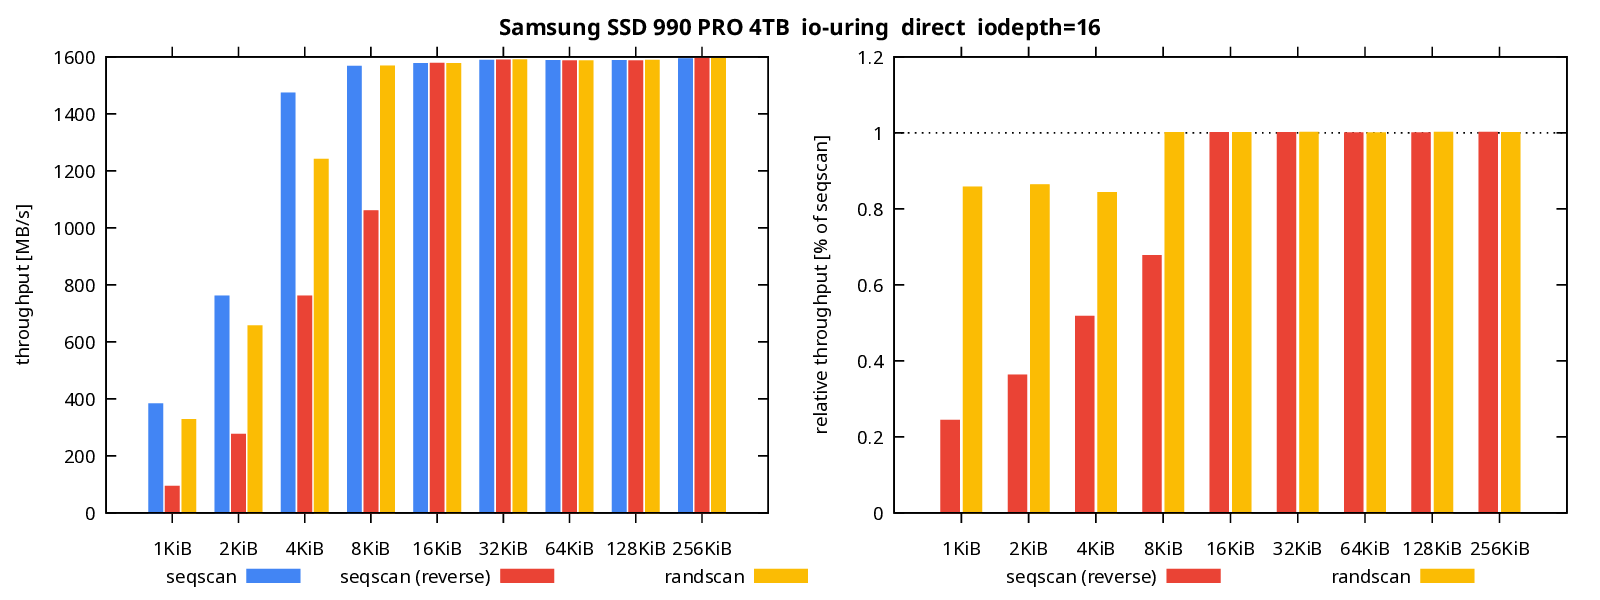
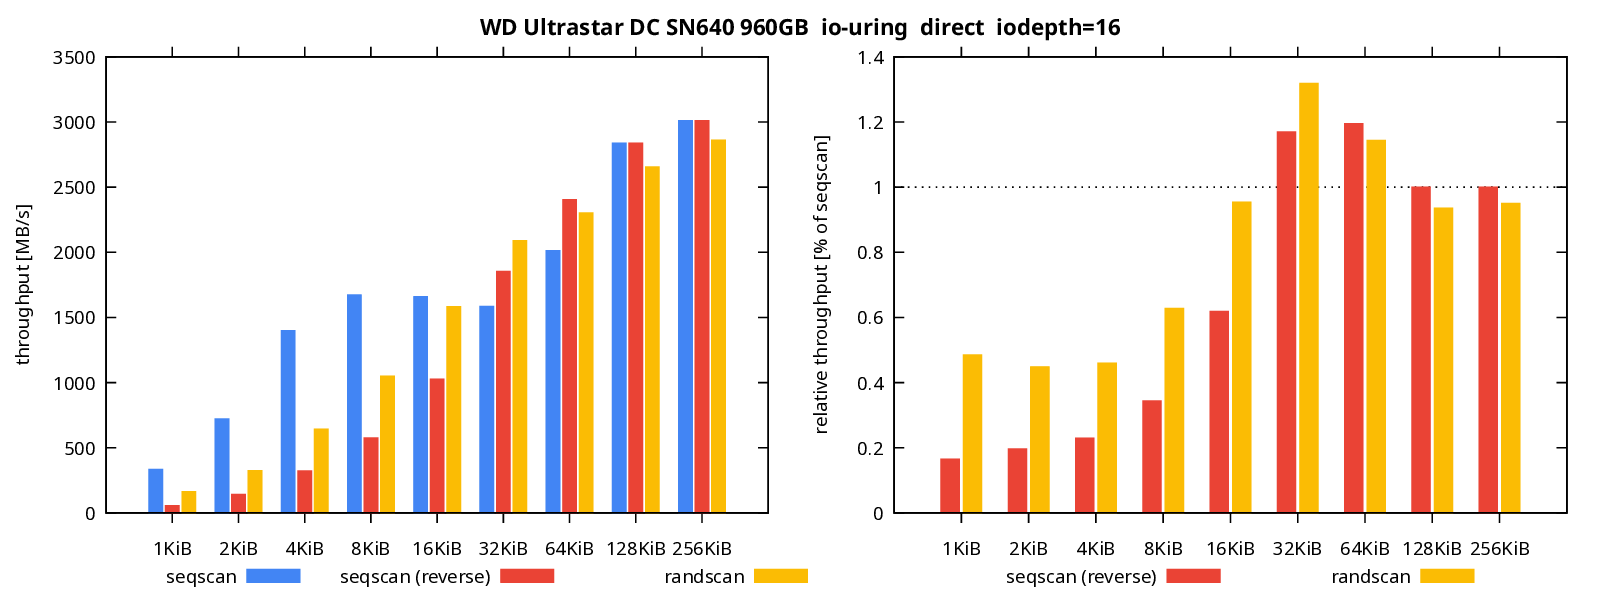
Results with direct I/O are interesting, because it makes it possible to say which bottlenecks are due to page cache and which are about SSD limits.
Samsung SSD 990 PRO 1TB (NVMe M.2, 4x, RAID0)
INTEL SSDSC2BA10 (SATA III, 4x, RAID0)
WD Blue SN5000 4TB (NVMe, M.2)
Samsung SSD 990 PRO 4TB (NVMe, M.2)
WD Ultrastar DC SN640 960GB (NVMe, U.3)
Analysis
Switching to direct I/O seems to affect the drives differently.
The last two drives (Samsung SSD 990 PRO 4TB and WD Ultrastar DC SN640 960GB) don’t seem to be affected very much. There are differences, but the charts are very close to buffered I/O.
For the other drives the behavior seems to change much more, and the charts are very different. The throughput grows more gradually (with the increasing block size), especially for the forward direction. This is probably due to the missing read-ahead (which only works for buffered I/O).
The consequence is a reduced difference between the forward and backward sequential reads. That’s due to forward reads being slower, not backward reads getting faster. Same thing for random reads.
However, page cache also seems to have some bottlenecks. Consider the RAID0 with 4 NVMe devices. With buffered I/O it did only ~10GB/s, while with direct I/O it did ~20GB/s (both results are with 256KiB blocks).
Even without the kernel read-ahead, differences between forward and backward sequential reads did not disappear. On some drives forward reads are still much faster than the reverse reads. That suggests the devices have some sort of read-ahead heuristics built-in, and it also works only for the “forward” direction.
Impact on queries
So now we know SSD devices can behave in surprising ways, violating “natural” expectations. Let’s see how this can affect query execution, resulting in very different timings for similar queries.
Let’s create a table t with perfectly correlated data - values in
column a increase from 1 to 10M. The table is ~8GB, the index is ~200MB.
CREATE TABLE t (a BIGINT, b TEXT) WITH (fillfactor = 10);
INSERT INTO t SELECT i, md5(i::text) FROM generate_series(1,10000000) s(i);
VACUUM FREEZE t;
CREATE INDEX t_idx ON t(a);
ANALYZE t;
And now consider two queries that differ only in the ORDER BY clause.
EXPLAIN SELECT * FROM t ORDER BY a ASC;

                                 QUERY PLAN
-----------------------------------------------------------------------------
 Index Scan using t_idx on t  (cost=0.43..1259691.44 rows=10000000 width=41)
(1 row)

EXPLAIN SELECT * FROM t ORDER BY a DESC;

                                      QUERY PLAN
--------------------------------------------------------------------------------------
 Index Scan Backward using t_idx on t  (cost=0.43..1259691.44 rows=10000000 width=41)
(1 row)
The costs are the same, surely the durations will be the same too …
This is on the buffered I/O (on the 4x NVMe RAID0), with cold caches (page cache dropped, shared buffers evicted):
EXPLAIN (COSTS OFF, ANALYZE) SELECT * FROM t ORDER BY a ASC;

                                   QUERY PLAN
---------------------------------------------------------------------------------
 Index Scan using t_idx on t (actual time=0.214..1909.990 rows=10000000 loops=1)
 Planning Time: 1.673 ms
 Execution Time: 2097.061 ms
(3 rows)

EXPLAIN (COSTS OFF, ANALYZE) SELECT * FROM t ORDER BY a DESC;

                                        QUERY PLAN
-------------------------------------------------------------------------------------------
 Index Scan Backward using t_idx on t (actual time=0.186..42167.727 rows=10000000 loops=1)
 Planning Time: 1.472 ms
 Execution Time: 42355.137 ms
(3 rows)
Well, 2097ms vs. 42355ms, that’s not exactly the same duration. What about with direct I/O?
EXPLAIN (COSTS OFF, ANALYZE) SELECT * FROM t ORDER BY a ASC;

                                    QUERY PLAN
----------------------------------------------------------------------------------
 Index Scan using t_idx on t (actual time=0.176..13975.469 rows=10000000 loops=1)
 Planning Time: 1.023 ms
 Execution Time: 14166.635 ms
(3 rows)

EXPLAIN (COSTS OFF, ANALYZE) SELECT * FROM t ORDER BY a DESC;

                                        QUERY PLAN
-------------------------------------------------------------------------------------------
 Index Scan Backward using t_idx on t (actual time=0.327..41453.136 rows=10000000 loops=1)
 Planning Time: 1.755 ms
 Execution Time: 41644.535 ms
(3 rows)
Now it’s closer, but only by making the forward scan slower (due to not having the read-ahead).
Conclusion
The behavior with SSDs is much more complicated, and heavily depends on the I/O pattern, which can have significant impact on query timings.
This problem only affects index scans. Sequential and bitmap scans always read data “forward”, which works fine both with buffered and direct I/O. Only index scans can do backward scans.
The index scan cost model however does not consider these effects. If
it did, maybe we’d pick a different plan with an explicit Sort.
Could the cost model account for these effects somehow? I can see some
challenges for doing that. The behavior seems to be somewhat specific to
the model/drive. And the pattern may not be known while planning the
query. If we look at the ORDER BY clause, index correlation, would
that be enough to predict the direction?
Sequential and bitmap scans also never visit the same block repeatedly, unlike index scans. That’s irrelevant for the examples presented in this post, but it’s causing issues for other queries shared in the index prefetching thread.
The index prefetching patch mitigates these issues - it does not adjust the costing, so we’ll end up with the same plan reading the data backwards. And it does not eliminate differences between SSDs. But it does increase the I/O depth, improving the throughput.
